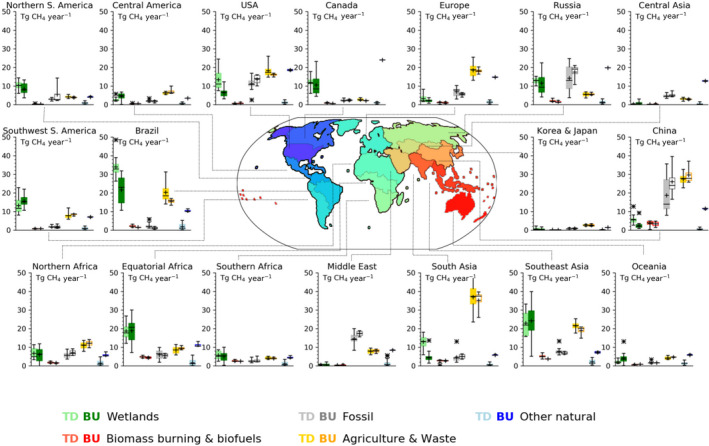
FIGURE 4.

The sectorial budget breakdown for each region in Tg CH4 yr−1 for the most recent decade (2008–2017) and a map of the 18 land regions used in this study. Each panel shows methane emissions for the five key sectors, from left to right: Wetlands, Biomass burning and biofuels, Fossil fuels, Agriculture & waste, and Other natural (including inland waters). Top‐down estimates are shown on the left as light‐colored boxes and bottom‐up estimates on the right as dark‐colored boxes. Sectoral emission estimates based on less than 5 data points are shown as open boxes and those with 5 or greater data points are shown as filled boxes. The box represents the 25th to 75th percentile range, “x” represents the outliers, and the whiskers show the minimum and maximum values (outliers excluded)
