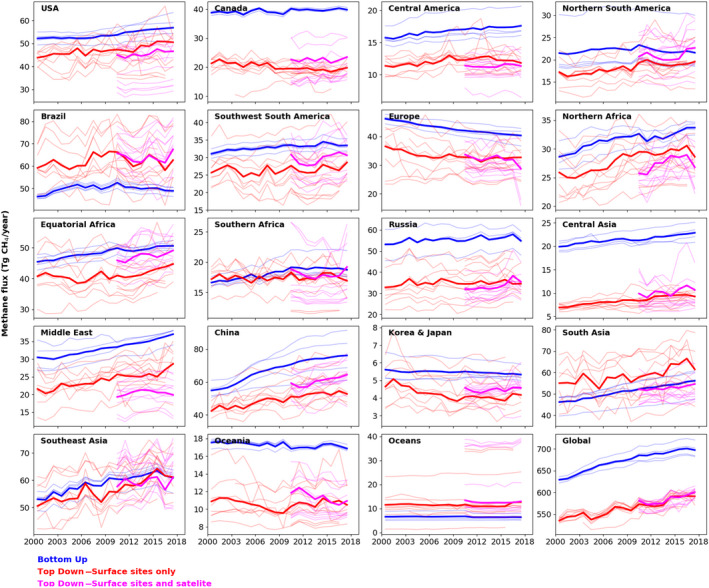
FIGURE 5.

Annual estimates of total CH4 emissions in Tg CH4 yr−1 for each of the 18 land regions, the ocean region and the global total over 2000–2017. Bottom‐up (blue) and top‐down (red—surface sites only, magenta—surface sites and satellite data). Thick lines indicate the mean estimate, whereas thin lines represent individual estimates
