
FIGURE 6.
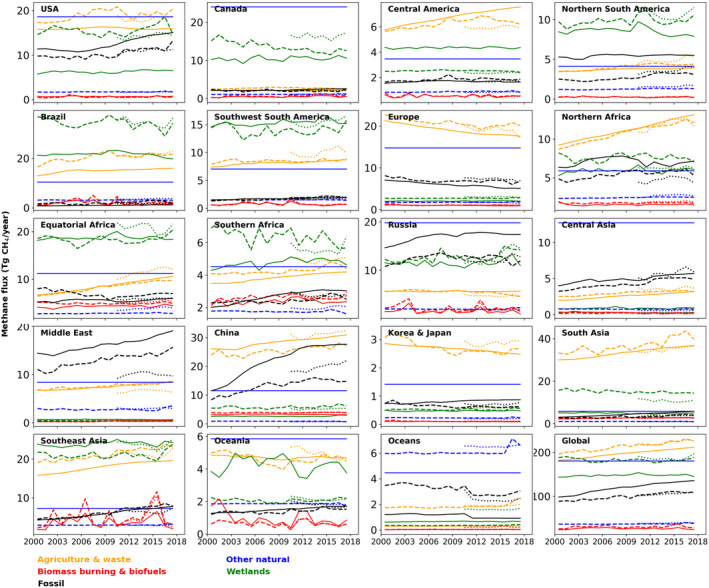
Yearly mean regional and global agriculture and waste (orange), biomass burning and biofuel (red), fossil fuels (black), other natural (blue) and wetland (green) fluxes in Tg CH4 yr−1 over 2000 to 2017. The mean of the bottom‐up estimates are shown as a solid line, the mean of the top‐down (surface sites only) as a dashed line and the mean of the top‐down estimates including GOSAT data as a dotted line