
Figure 1.
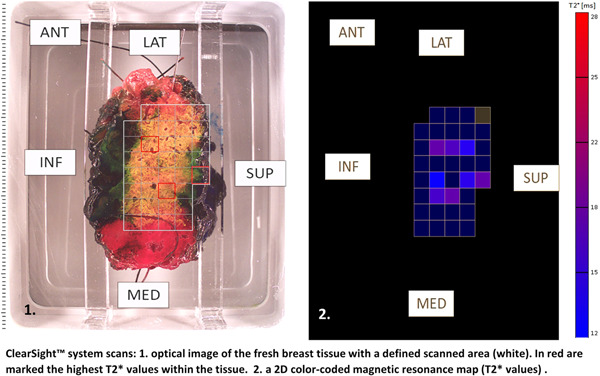
ClearSight™ system scans: (1) Optical image of the fresh breast tissue with a defined scanned area (white). In red are marked the highest T2* values within the tissue. (2) A 2D color‐coded magnetic resonance map (T2* values). 2D, two dimensional; ANT, anterior; INF, inferior; LAT, lateral; MED, medial; SUP, superior