
Figure 4.
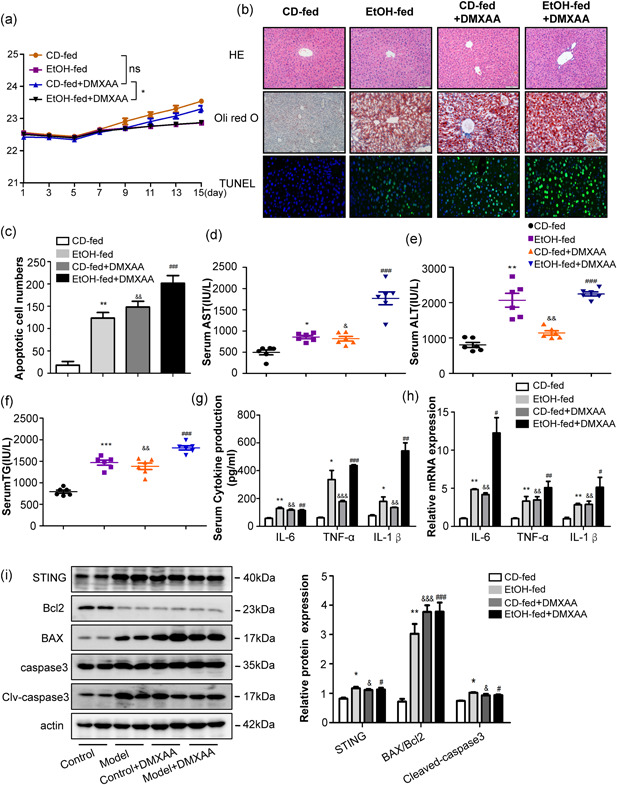
DMXAA induced apoptosis and inflammation in the livers of mice. WT mice were treated with DMXAA for 16 days. Graphs show the body weight (a). Representative H&E, Oil Red staining and Tunel staining of liver tissue sections (b, c). Scale bars: 100, 100, and 50 μm. Serum AST, ALT and TG levels (d–f). The circulation levels of proinflammatory cytokines, including TNF‐α, IL‐1β, and IL‐6 were determined by ELISA in serum (g). The mRNA levels of TNF‐α, IL‐1β, and IL‐6 were detected by RT‐qPCR in primary KCs (h). Protein levels of Bax, Bcl2, caspase3, and cleaved‐caspase3 (i). n = 6 in each group. Values are shown as mean ± SEM. *p < 0.05, **p < 0.01, ***p < 0.001 compared to CD‐fed group, & p < 0.05, && p < 0.01, &&& p < 0.001 compared to CD‐fed group. # p < 0.05, ## p < 0.01,### p < 0.001 compared to CD‐fed group. For all panels, data represent the mean ± SEM for three independent experiments. ALT, alanine aminotransferase; AST, aspartate aminotransferase; DMXAA,; ELISA, enzyme‐linked immunosorbent assay; H&E, hematoxylin and eosin; KC, Kupffer cell; mRNA, messenger RNA