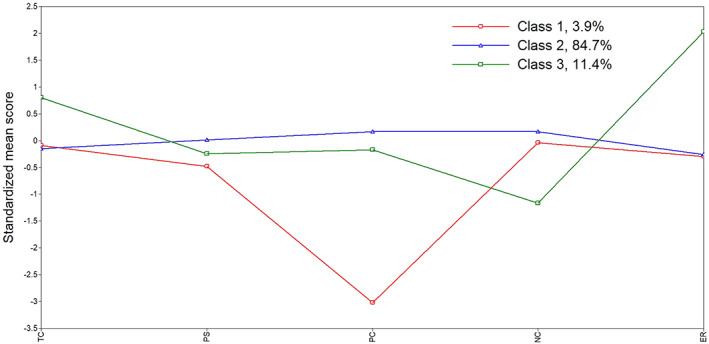
Figure 1.

Plot of the standardised mean scores of self‐perceptions of ageing (SPA) across the three identified latent profiles in the test sample. TC, timeline‐chronic; PS, Consequences Positive; PC, Control Positive; NC, Consequences and Control Negative; ER, Emotional Representations.
