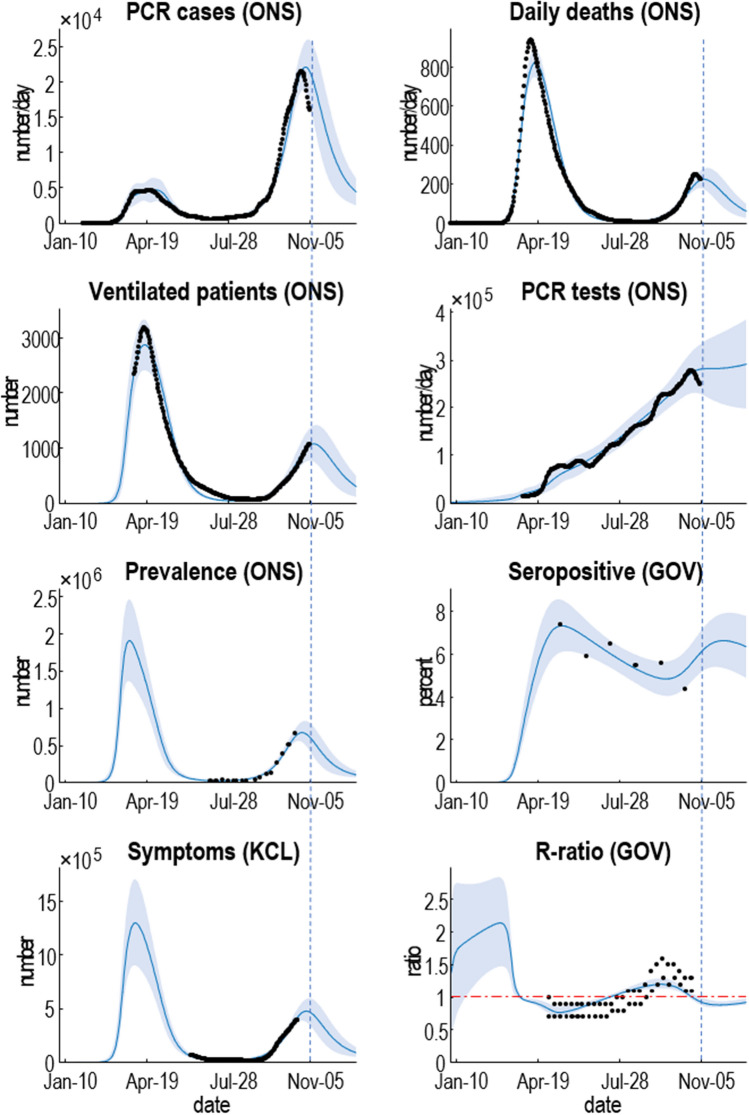
Figure 1.
Posterior predictions of various outcome modalities, ranging from confirmed cases through to the reproduction ratio. The black dots correspond to smoothed empirical data from the publicly available sources listed in the main text. The blue lines and shaded areas correspond to the posterior expectation and 90% Bayesian credible intervals based upon the posterior predictive density. The vertical blue dashed line indicates the date at which the analysis was performed.

