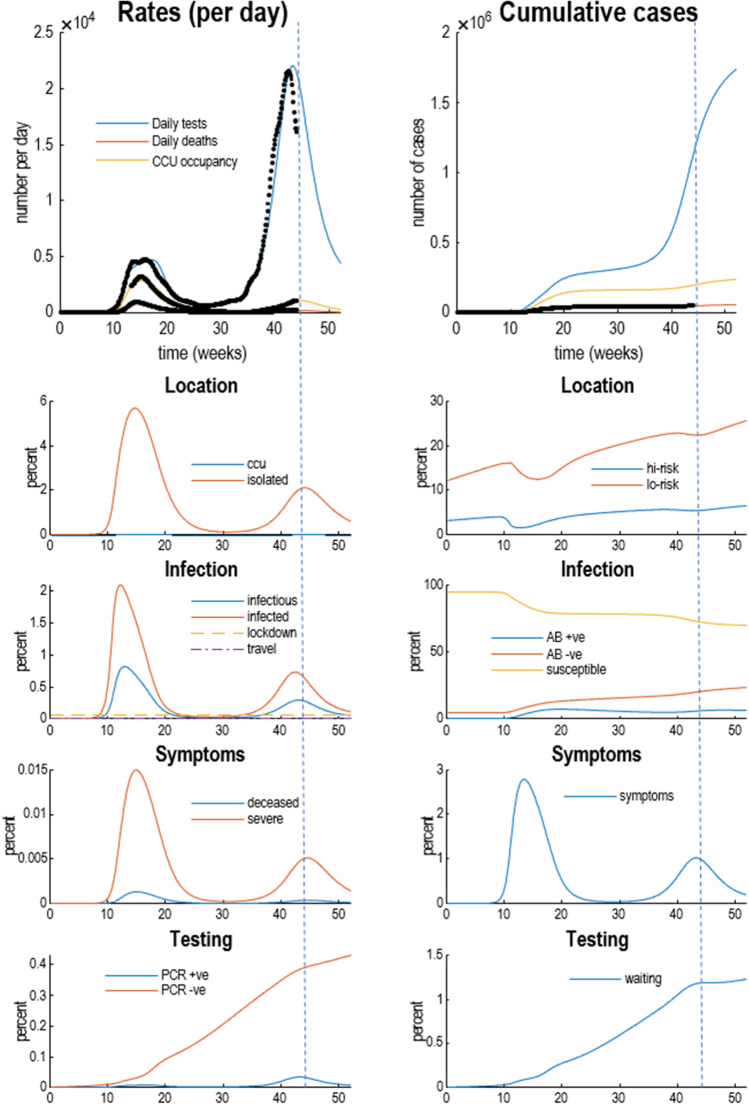
Figure 3.
Posterior predictions and underlying latent states. The upper two panels show selected outcomes from the previous figures (black dots): here, daily confirmed cases using PCR testing, daily deaths, and critical care occupancy. The upper left panel shows the rates, while the upper right panel shows the cumulative totals. The remaining panels detail fluctuations in the latent states of the four factors. Each factor has two panels, showing each of the accompanying levels. For clarity, some levels have been omitted because the probabilities of being in any level—of any given factor—sum to one. For a more detailed explanation of what these latent states mean—and how they can be interpreted—please see the Supplementary Information.

