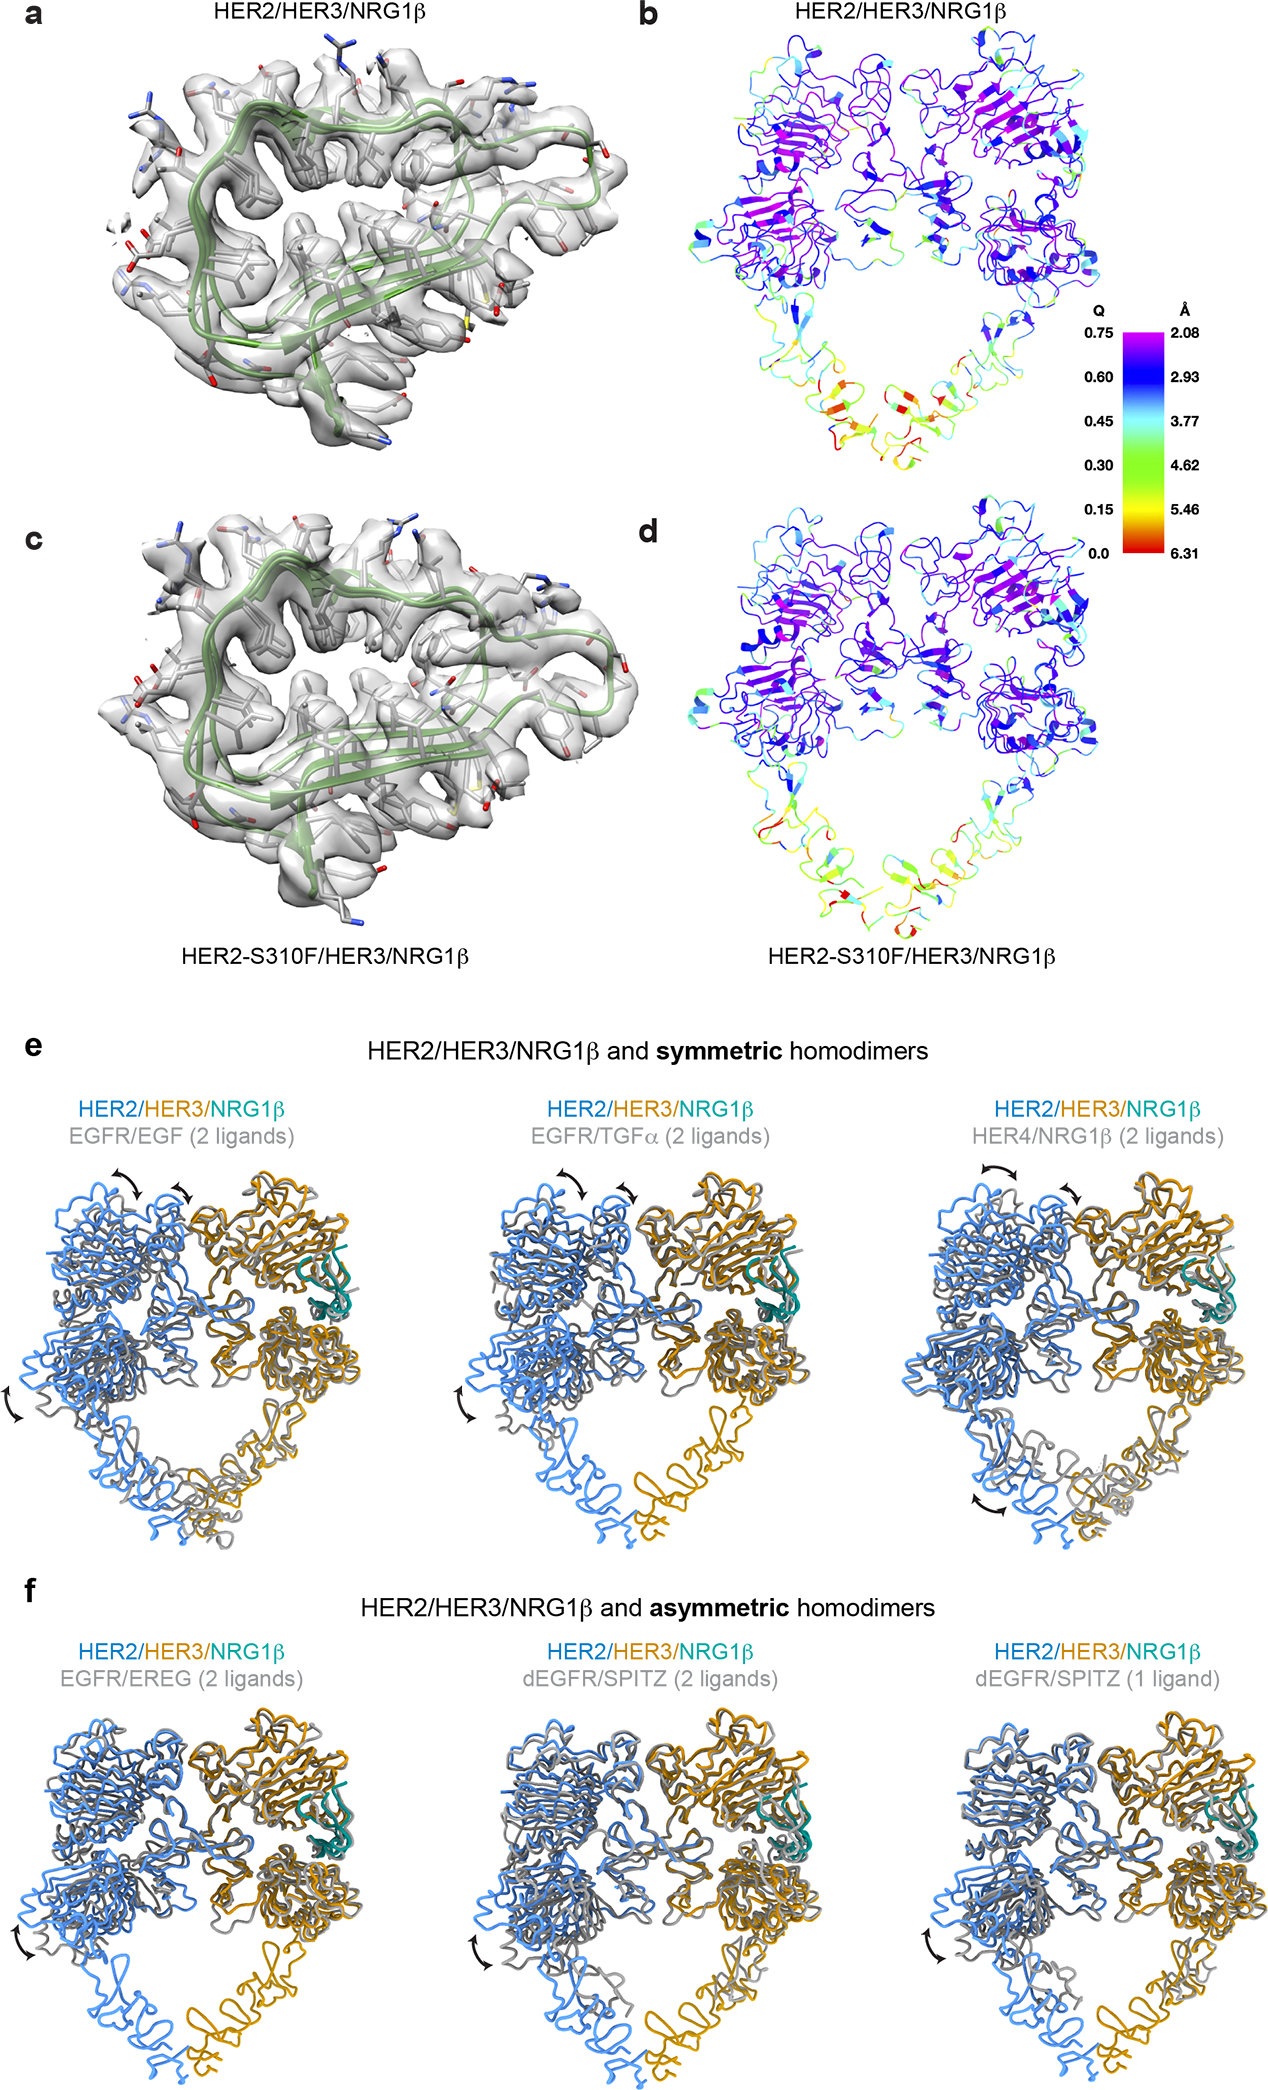
Extended Data Fig. 3 |. Q-score analysis of the cryo-EM maps and a structural comparison of the HER2/HER3/NRG1β heterocomplex with crystal structures of previously reported HER receptor structures.

a, Zoomed-in view of the cryo-EM density and model of WT HER2/HER3 (residues 63–150 of HER3) showing features appropriate for the reported resolution. b, WT HER2/HER3 model colored by estimated per residue Q-score ranging from 0 (red) to 0.75 (blue). The color bar shows corresponding estimated resolution in Å for each Q-score. Expected Q-score for 2.9Å map is 0.604. c, Zoomed-in view of the cryo-EM density and model of HER2 S310F/HER3 (residues 63–150 of HER3) showing features appropriate for the reported resolution. d, HER2-S310F/HER3 model colored by estimated Q-score with the same scale as in b. Expected Q-score for 3.1Å structure is 0.569. e, Overlay of the HER2/HER3/NRG1β heterocomplexes with symmetric structures of EGFR/EGF (PDB ID 3NJP), EGFR/TGFα (PDB ID 1MOX) and HER4/NRG1β (PDB ID 3U7U). f, Overlay of the HER2/HER3/NRG1β heterocomplexes with asymmetric structures of EGFR/EREG (PDB ID 5WB7), doubly liganded dEGFR/SPITZ (PDB ID 3LTF) and singly liganded dEGFR/SPITZ (PDB ID 3LTG). All structures were aligned on HER3. Differences between the heterodimer and the homodimers are primarily appreciated in overlays on the HER2 monomer. The heterodimer more closely resembles asymmetric homodimers than symmetric homodimers but reflects a unique conformation that is not seen in previous structures.
