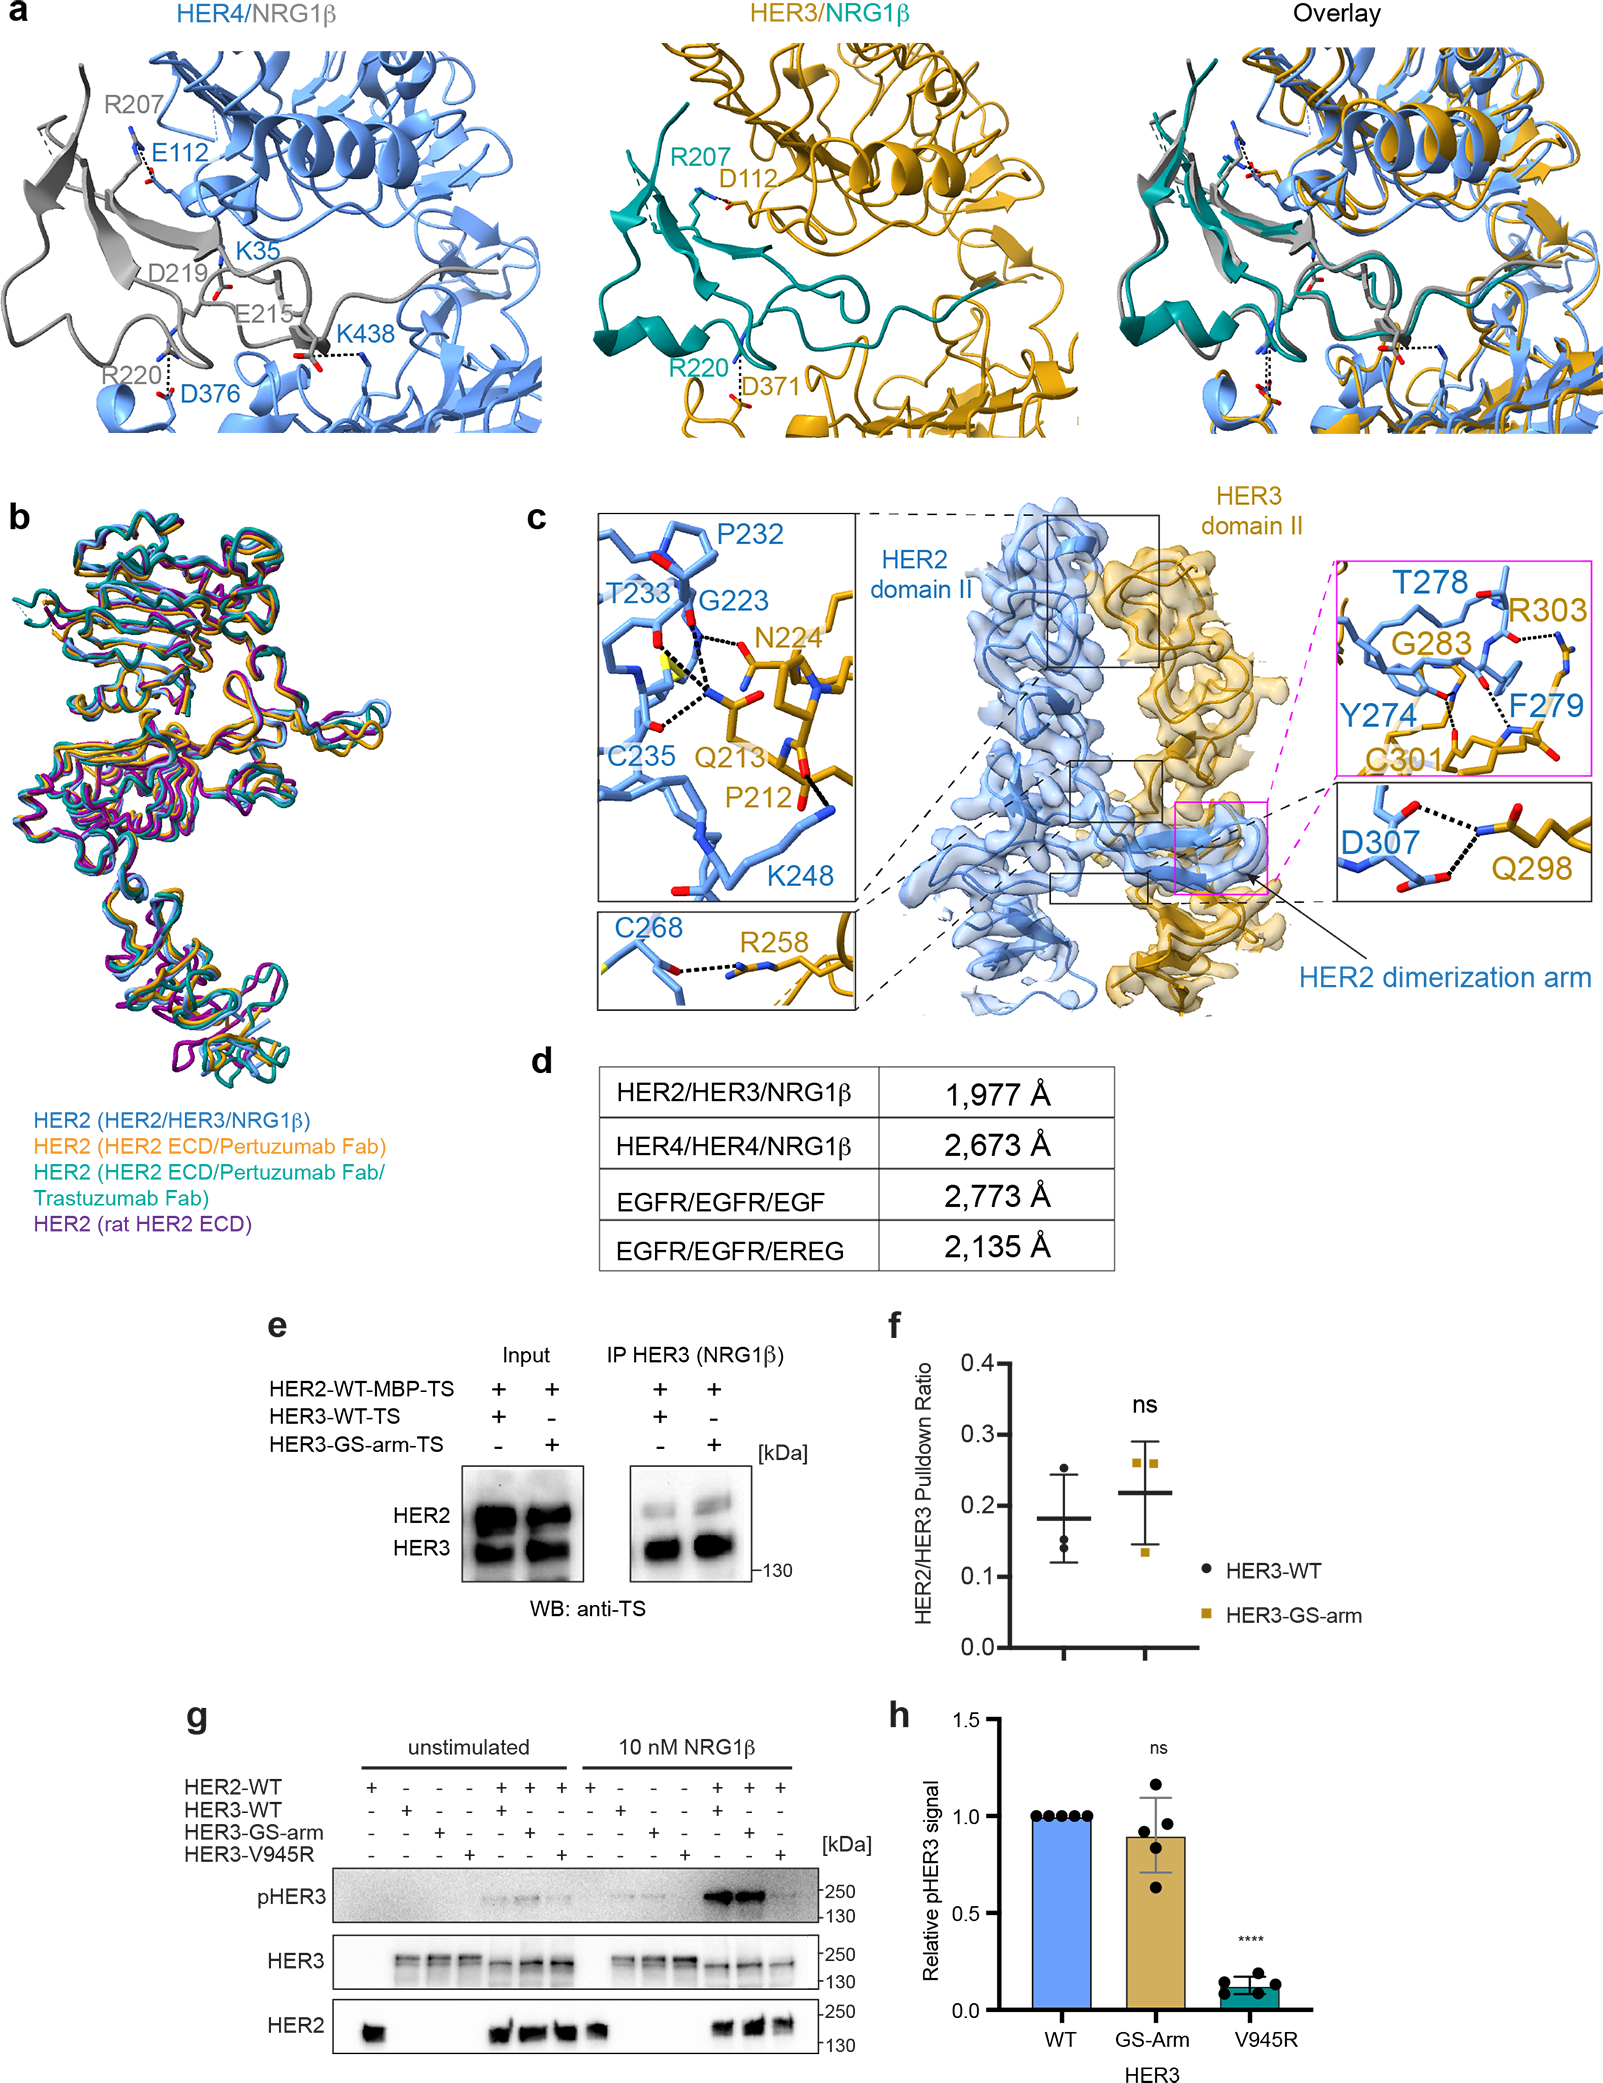
Extended Data Fig. 5 |. In-depth structural and functional analysis of the NRG1β binding-site and the HER2/HER3 dimerization interface.

a, Left, HER4 bound to NRG1β (PDB ID 3U7U) with salt-bridge interactions highlighted. Middle, HER3 bound to NRG1β in our structure with salt bridge interactions highlighted. NRG1β engages with HER3 primarily through an extensive interaction network at its C-terminus (total buried surface area: 2,803 Å2) stabilized by salt bridges between R207 (NRG1β) and D112 in HER3 domain I, and R220 (NRG1β) and D371 in HER3 domain III, bringing domains I and III into close proximity. Right, overlay between the two structures shows that the overall orientation of the ligand and some salt-bridge interactions are shared between HER3 and HER4, but overall HER3 forms fewer salt bridges with NRG1β than HER4. b, Structure of HER2 in our HER2/HER3/NRG1β dimer structure is overlayed with the crystal structure of the HER2 extracellular domain bound to trastuzumab Fab (PDB ID 1N8Z), the cryo-EM structure of the HER2 extracellular domain bound to pertuzumab and trastuzumab Fabs (PDB ID 6OGE) and the crystal structure of the rat HER2 extracellular domain (PDB ID 1N8Y). The structures are almost identical with root mean squared deviations (RMSDs) as following: 1.01 Å (1N8Z), 0.74 Å (1N8Y), 0.97 Å (6OGE). Minor conformational changes are observed in the dimerization arm and domain IV. c, Detailed view of the dimerization interface between domains II of HER2 and HER3 in the HER2/HER3/NRG1β structure with all polar contacts between receptors highlighted in the boxes to the left and to the right. d, Calculated buried surface area at the dimerization interface for HER2/HER3/NRG1β complex and the known structures of the dimeric HER extracellular domain complexes. The following structures were used for the analysis: EGFR/EGF (PDB ID 3NJP), EGFR/EREG (PDB ID 5WB7), HER4/NRG1β (PDB ID 3U7U). e, Representative Western Blot analysis of the HER2 and HER3 (wild-type HER3 and HER3 GS-arm) constructs co-transfected in the EXPI293 cells and pulled-down via NRG1β immobilized on FLAG beads. TS – Twin Strep tag (present on both HER2 and HER3). Receptors were detected with the Strep-Tactin® HRP conjugate (anti-TS). For gel source data, see Supplementary Figure 1. f, Quantification of data shown in panel e. Values are presented as mean values +/− SD of mean intensity ratios of HER2 over HER3 for each blot in n=3 independent biological replicates. The HER2/HER3 pulldown ratios are 0.18 +/− 0.06 for HER3-WT and 0.22 +/− 0.07 for HER3-GS-Arm complexes. Significance was determined via unpaired, two-tailed t-test via GraphPad Prism. p=0.5463, t=0.6582, df=4. g, Anti-phospho-HER3 (pHER3, Y1289), anti-HER3 and anti-HER2 Western Blot analysis of lysates from COS7 cells transfected with indicated full-length receptors (wild type or carrying the indicated mutations), serum-starved and stimulated with 10 nM NRG1β for 10 min. HER3-V945R is a negative control due to the presence of mutation in the active kinase dimer interface. For gel source data, see Supplementary Figure 1. h, Quantification of data shown in panel g. Values are presented as mean values +/− SD of pHER3 intensities of the mutant relative to wild-type HER3 for each blot in n=5 independent biological replicates. The mean intensity values are 0.90 +/− 0.19 for the HER3-GS-Arm and 0.13 +/− 0.04 for HER3-V945R relative to the WT with defined values of 1. Significance was determined via unpaired, two-tailed t-test via GraphPad Prism. HER3 GS-arm vs HER3: p=0.2887, t=1.136, df=8, HER3 vs HER3 V945R: p<0.0001, t=43.89, df=8.
