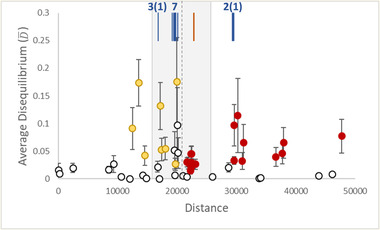
Figure 5.

Levels of average linkage (gametic) disequilibria () for populations sampled across the hybrid zone between Ranunculus occidentalis (yellow) and R. austro‐oreganus (red). Filled markers represent estimates that are significantly different from zero. Error bars represent the standard deviation. The gray shaded area indicates the 95% confidence intervals of centers for the neutral introgression SNP clines, and the vertical dashed line is the hybrid zone center. The blue vertical lines indicate the centers of clines classified as tension zones, with the number in each cluster that are nuclear SNPs and cytoplasmic (in parentheses) haplotypes (each represented by multiple SNPs; Fig. S5). The orange vertical line represents the center of the ventral petal color cline.
