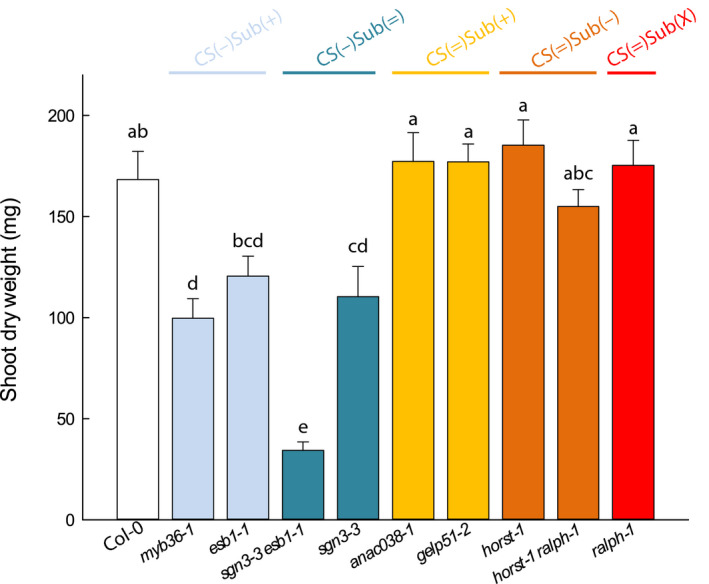
Fig. 6.

Relative shoot growth in Col‐0 and a collection of nine Casparian strips (CS) and/or suberin Arabidopsis mutants in control conditions. Plants were grown for 5 wk in a Phenopsis phenotyping platform under controlled environmental conditions (means ± SE, n = 7). Letters above the bars indicate significant differences among means after one‐way ANOVA and post hoc Tukey's test (α = 0.05).
