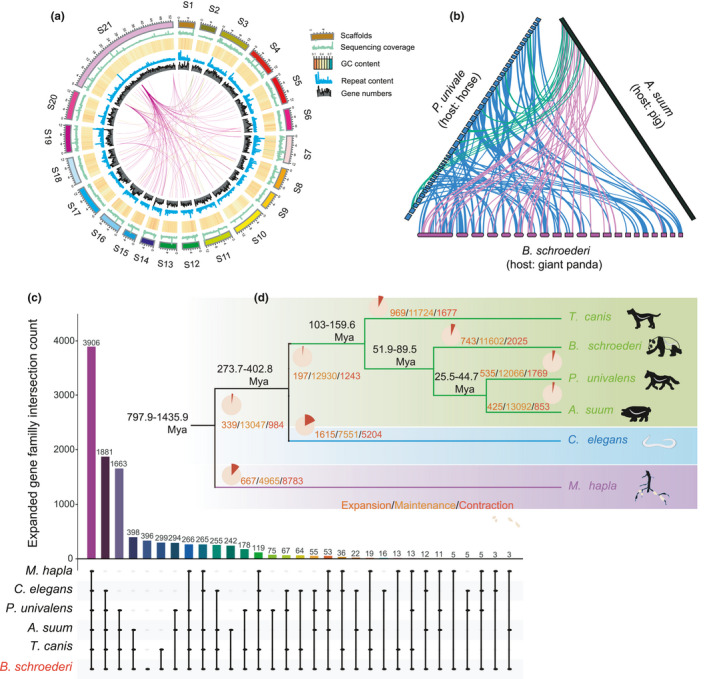
FIGURE 1.

The phylogenetic relationships among six nematodes and genomic characteristics and synteny of B. schroederi. (a) Genomic characterization of B. schroederi genome. The figure shows the gene number, repeat content, GC content, sequencing coverage and scaffolds from the centre to the edge. (b) Synteny of B. schroederi with P. univalens and T. canis at the gene level. Different colours represent different synteny blocks. (c) Upset plot showing the intersection of gene family expansions in nematodes. Each row represents a nematode. Black circles and vertical lines between the rows represent the intersection of expanded families between species. The barplot indicates the total gene family count in each intersection. (d) Time‐calibrated maximum likelihood phylogenetic tree of six nematodes. The estimated divergent times are shown at the bifurcations. The numbers below the nodes represent the number of gene families significantly expanded, maintained, and contracted, respectively
