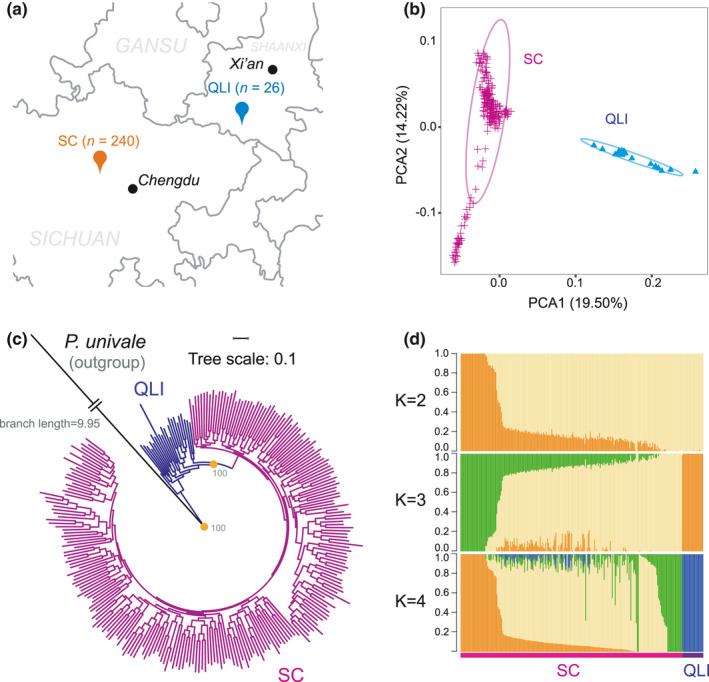
FIGURE 6.

Population structure and relationships of Sichuan (SC) in comparison to Qinling (QLI) population. (a) The geographic distribution of the sampling locations for QLI and SC populations. (b) Principal component analysis (PCA) analysis of two populations. (c) A maximum likelihood (ML) phylogenetic tree with 100 bootstrap tests constructed using whole‐genome SNPs information. We used P. univale as the outgroup. (d) Population structure of SC and QLI populations (K from 2 to 5). The y‐axis quantifies the proportion of the individual's genome from inferred ancestral population, and x‐axis shows the different individuals
