FIGURE 7.

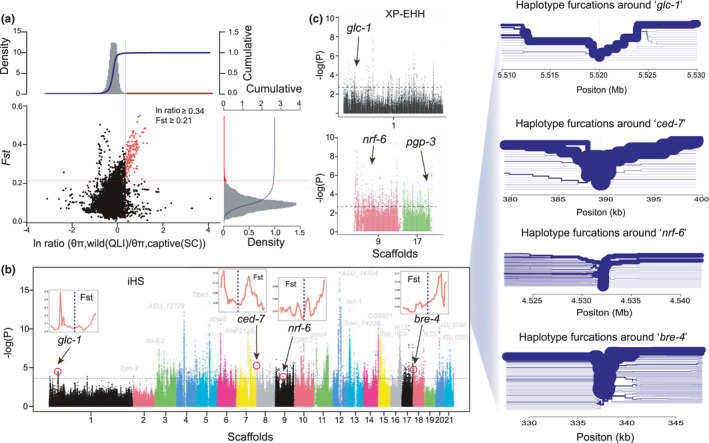
Analysis of natural selection in captive populations. (a) Genomic regions with selection sweep signals in captive (SC) and wild (QLI) B. schroederi population. Distribution of ln ratio (θπ, wild(QLI)/θπ, captive(SC)) and F ST of 50 kb windows with 10 kb steps. Red dots represent windows fulfilling the selected regions requirement (corresponding to Z test p < .005, where F ST > 0.21 and ln ratio >0.34). (b) Plot of iHS showing loci under positive selection of captive (SC) population. SNPs with |iHS|≥iHSm (3.89, top 1%) were shown above the dashed horizontal line. Nucleotide diversity around glc‐1, nrf‐6, ABC transporter ced7 and bre‐4 loci using 10‐kb sliding windows were displayed above the genes. The decay of haplotype homozygosity around a focal marker were displayed on the right side of the figure. The furcation structures represent the complete information contained in the concept of extended shared haplotypes EHH (Sabeti et al., 2002). The root (focal marker) is indicated by a vertical dashed line. The thickness of the lines corresponds to the number of scaffolds sharing a haplotype. (c) XP‐EHH from each SNP core showing the same nucleotide between the subject and the comparison target, also transformed to p‐values and plotted in logarithmic scale
