Figure 8.

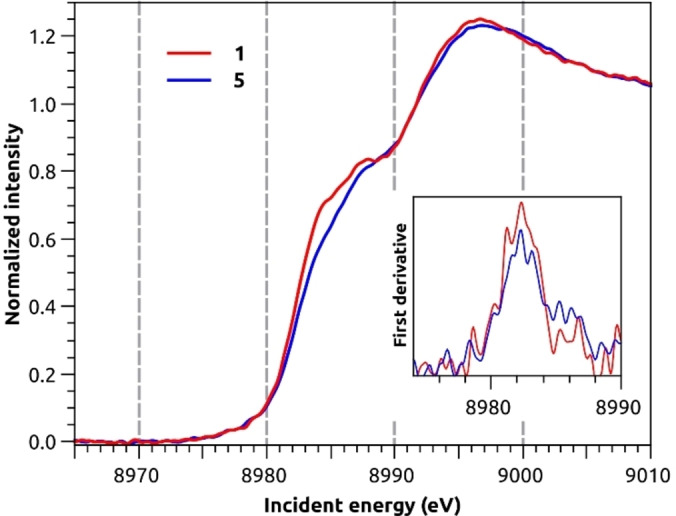
Cu K‐edge X‐ray absorption spectra of 1 (red) and 5 (blue) calibrated versus the first inflection point of Cu foil at 8980.3 eV. The first derivative (inset) highlights the first inflection point of the samples at 8982.2 eV for both.

Cu K‐edge X‐ray absorption spectra of 1 (red) and 5 (blue) calibrated versus the first inflection point of Cu foil at 8980.3 eV. The first derivative (inset) highlights the first inflection point of the samples at 8982.2 eV for both.