
Table 1.
15N NMR shifts in ppm. The spectra are recorded in d6 ‐DMSO, unless noted otherwise. All shifts are reported relative to an external nitromethane standard. Coordination shifts Δδ15N, if obtained, are given in squared brackets. 1H‐15N HMBC spectra of complexes 1–6 and their ligands are given in the SI.
|
| ||||
|---|---|---|---|---|
|
Compound |
δ15Nimine [Δδ15Nimine] |
δ15Npyridine [Δδ15Npyridine] |
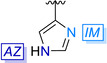
δ15NIM [Δδ15NIM] |
δ15NAZ [Δδ15NAZ] |
|
1 |
−83.2 [−13.7] |
|
−173.4 [−57.3] |
−203.7 [+7.1] |
|
2 |
−86.0 [−16.1] |
|
−171.7 [−55.2] |
−205.6 |
|
3‐M |
−89.6 [−41.7] |
−128.6 [−67.0] |
|
|
|
3‐D |
−107.7 [−59.8] |
−105.3 [−43.7] |
|
|
|
4 |
−94.0 [−46.1] |
−126.8 [−64.3] |
|
|
|
5 [a] |
−79.1 |
|
−170.5 |
−211.4 |
|
6 |
−86.1 [−21.1] |
|
−170.0 [−52.8] |
−206.1 [+3.5] |
[a] measured in acetonitrile.