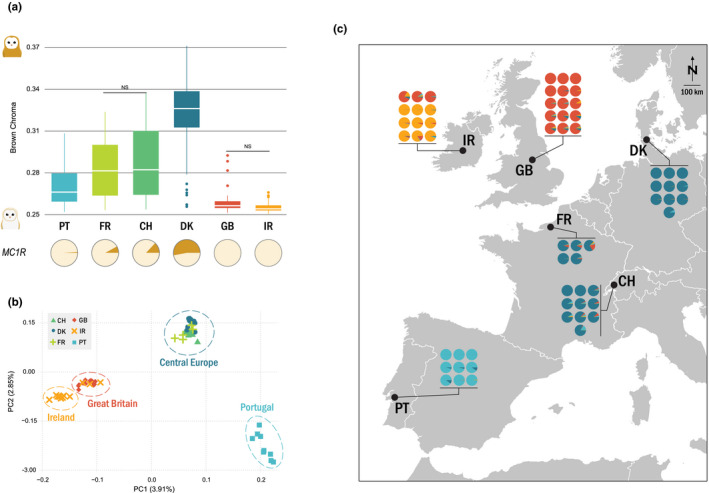
FIGURE 1.

Coloration and genetic structure of barn owl populations in western Europe. (a) Brown chroma distribution and MC1R allelic frequencies of each studied population (total n = 145). Higher brown chroma indicates redder owls. NS denotes the nonsignificant pairwise comparisons. The pies below the plot illustrate the populations’ MC1R allelic frequencies: the rufous allele in brown and the white in beige. (b) PCA based on the pruned data set (319,801 SNP) of the 61 individuals whose whole genome was resequenced. Point shape and colour denote populations according to the legend. Dashed circles enclose sample clusters identified in sNMF. Values in parenthesis indicate the percentage of variance explained by each axis. (c) Population structure. Small pie charts denote the individual proportion of each of k = 4 lineages as determined by sNMF. Black dots are located at the approximate centroid of each sampled population
