FIGURE 5.

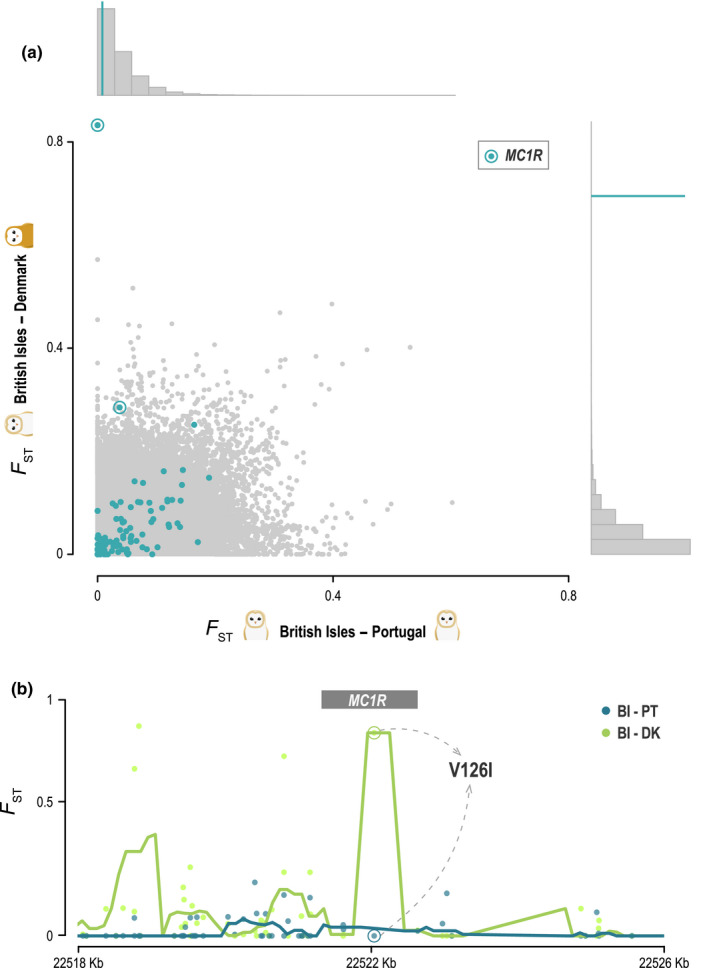
Differentiation at the colour‐linked locus V126I of the MC1R gene between differently coloured barn owl populations in Europe. (a) Genome‐wide F ST values per window (in grey, 20 Kbp windows with 5Kbp steps), between two white barn owl populations on the horizontal axis – British Isles (BI) and Portugal (PT) – and between one white and one rufous on the vertical axis – BI and Denmark (DK). The distribution of each axis is shown on the histograms. Blue dots indicate the F ST at windows containing the tested colour‐linked genes. Windows containing the MC1R are encircled, and their mean is shown with the blue line on the histograms. (b) F ST per site (dots) around the MC1R gene (grey box). Lines show the mean over sliding windows (500bp with 100bp step), for the same comparisons as above: BI and PT in blue; BI and DK in green. Circled dots indicate the V126I locus in both comparisons
