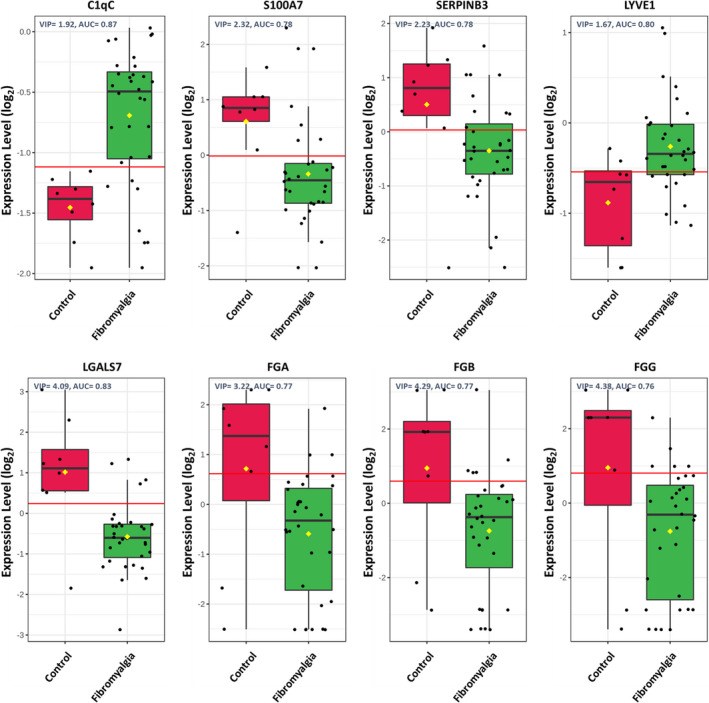
FIGURE 2.

Potential proteomics biomarkers in fibromyalgia (FM). Graphs show serum proteins with a significant change in expression between FM patients and healthy controls for C1qC, S100A7, SERPINB3, LYVE1, LGALS7, FGA, FGB and FGG. The plot shows expression levels on the y‐axis and their group on the x‐axis. Values for all individual cases are shown as dots. Horizontal lines are median, box edges are interquartile range and whiskers are range
