Figure 2.
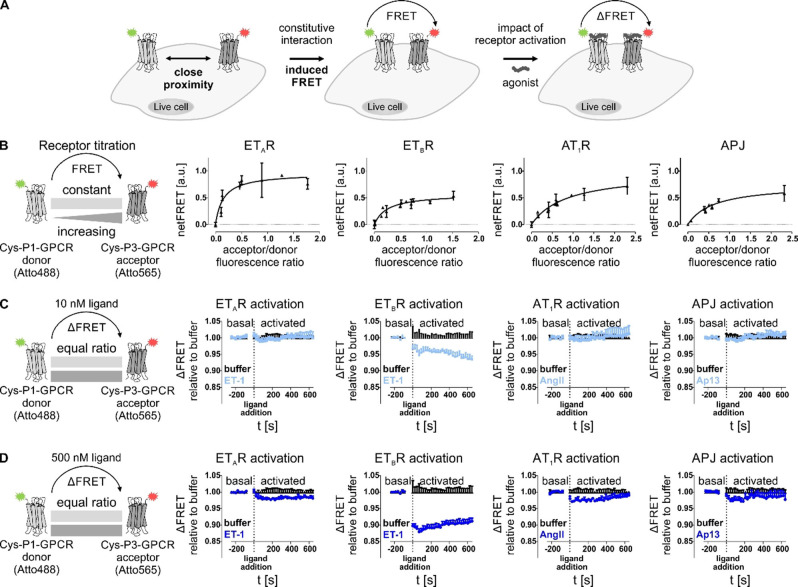
Determination of constitutive proximity between GPCRs in homo‐receptor clusters by FRET analyses. (A) Close proximity of two GPCR protomers, equipped with either Atto488 (green star) or Atto565 (red star) by peptide‐templated acyl transfer enables Förster resonance energy transfer (FRET). Activation of labeled GPCRs by agonist application can trigger changes in FRET fluorescence due to conformational rearrangement of the receptor. (B) To assess local association of membrane‐embedded GPCRs from the same species (left to right: ETAR, ETBR, AT1R, APJ), receptor titration experiments were performed by transfecting HEK293 cells with constant amounts of P1‐tagged GPCR (subsequently addressed with the FRET donor) and increasing amounts of P3‐tagged GPCR (subsequently labeled with the FRET acceptor). Labeling was simultaneously performed with Atto488‐P2 (FRET donor, green) and Atto565‐P4 (FRET acceptor, red). To determine the acceptor/donor fluorescence ratio at the cell membrane (x axis), either acceptor or donor labeling was performed to determine the respective fluorescence signal of membrane‐embedded GPCRs and exclude intracellularly retained receptor subpopulations. FRET measurement was performed in quadruplicates (n≥2). NetFRET values were determined by subtraction of fluorescence values derived from cells, expressing only the P1‐GPCR (donor). Data represent the mean over all assay repetitions. GPCR proximity is indicated by signal saturation. (C, D) The influence of receptor activation on the proximity‐induced FRET was determined by transfecting P1‐tagged donor GPCR and P3‐tagged acceptor GPCR using equal amounts (1 : 1 ratio). After receptor labeling, the baseline (basal FRET) was monitored before addition of different ligand concentrations (C: 10 nM ligand; D: 500 nM ligand) at t=0 s. ET‐1 was used for activation of ETAR and ETBR, AngII for activation of AT1R, and Ap13 for activation of APJ (left to right: ETAR, ETBR, AT1R, APJ). Ligand‐induced effects on the FRET signal were observed for 10 min after ligand addition. Curves represent the deviation of the FRET signal after ligand addition to the basal FRET (prior to ligand addition) relative to the respective buffer control. (kinetic analysis n=3, each performed in quadruplicates; black: buffer, light blue: 10 nM ligand, blue: 500 nM ligand; representative kinetic data shown).

