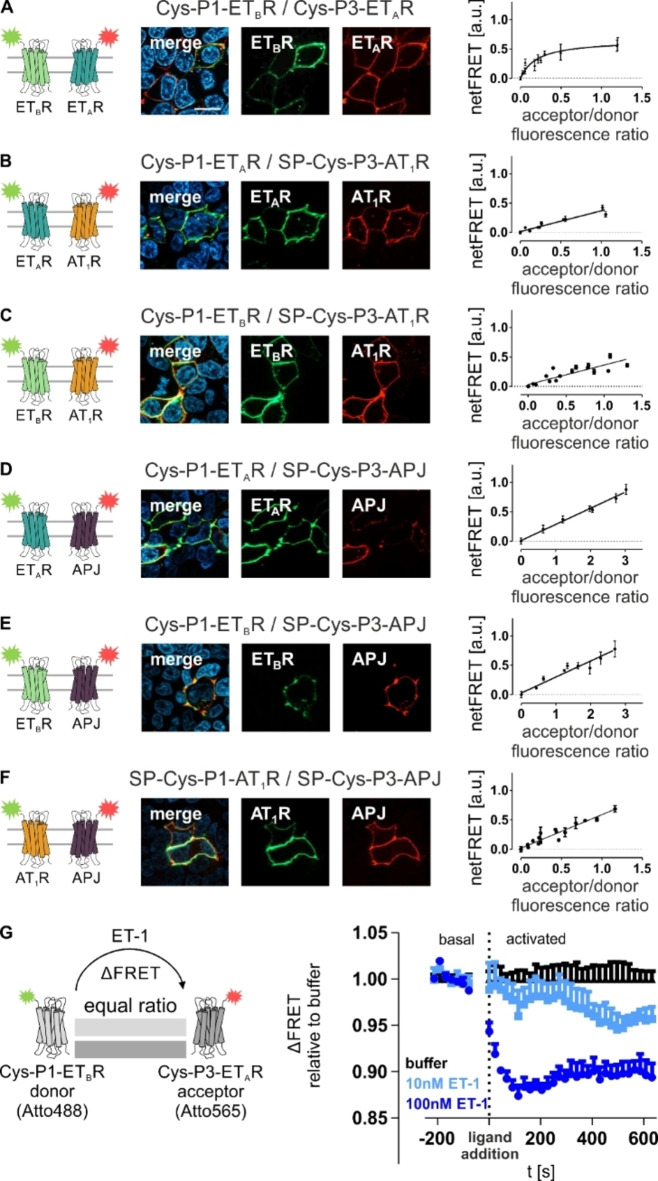
Figure 4.
Determination of constitutive proximity between GPCRs in hetero‐receptor clusters by proximity‐dependent FRET analyses. For constitutive interactions of membrane‐embedded GPCRs from different species, receptor titration experiments were performed by transfecting HEK293 cells with constant amounts of P1‐tagged GPCR (subsequently addressed with the FRET donor) and increasing amounts of P3‐tagged GPCR (subsequently labeled with the FRET acceptor). Labeling was simultaneously performed with Atto488‐P2 (FRET donor, green) and Atto565‐P4 (FRET acceptor, red). Formation of specific interaction is indicated by hyperbolic fitting of the ETAR/ETBR proximity‐dependent FRET data (A). A linear correlation was observed for ETAR/AT1R (B), ETAR/APJ (C), ETBR/AT1R (D), ETBR/APJ (E), and AT1R/APJ (F) in the absence of receptor activation. Successful peptide‐templated labeling was validated for all investigated GPCR combinations (fluorescence microscopy n=3; representative image shown). (G) For ligand‐driven effects on constitutive ETAR/ETBR proximity‐dependent FRET, FRET was observed without ligand post labeling (basal). Upon stimulation (10 nM ET‐1: light blue; 500 nM ET‐1: dark blue), the FRET fluorescence was observed for 10 min (n≥2 each performed in quadruplicates, representative kinetic data shown). ETAR: blue, ETBR: light green, AT1R: orange, APJ: purple. Scale bar: 10 μm.

