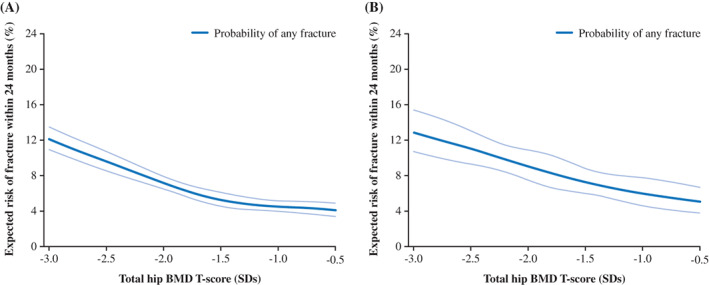
Fig. 2.

Relationship between total hip T‐score and risk of any clinical fracture at 24 months (%) in (A) Cohort 1 (BP‐naïve patients)a and (B) Cohort 2 (BP‐treated patients). aPatients had not received BP treatment for at least 12 months prior to index date. Pale blue lines show the 95% confidence interval. BMD = bone mineral density; BP = bisphosphonate; SD = standard deviation.
