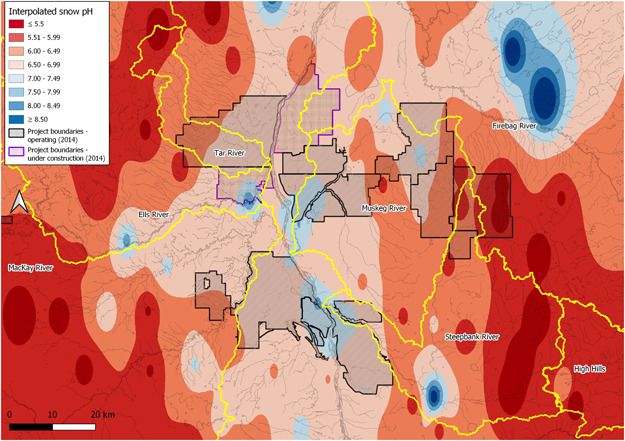
Figure 5.

Interpolated surface (inverse distance weighting; QGIS 3.16) of pH in snow samples collected in 2014; distance coefficient = 2; data available from OSM Portal: https://www.canada.ca/en/environment-climate-change/services/oil-sands-monitoring/monitoring-water-quality-alberta-oil-sands.html; also shown are the major watersheds in the minable region obtained from http://www.ramp-alberta.org/RAMP.aspx. High Hills watershed was delineated using Upslope Area in QGIS (3.16)
