Fig. 8.

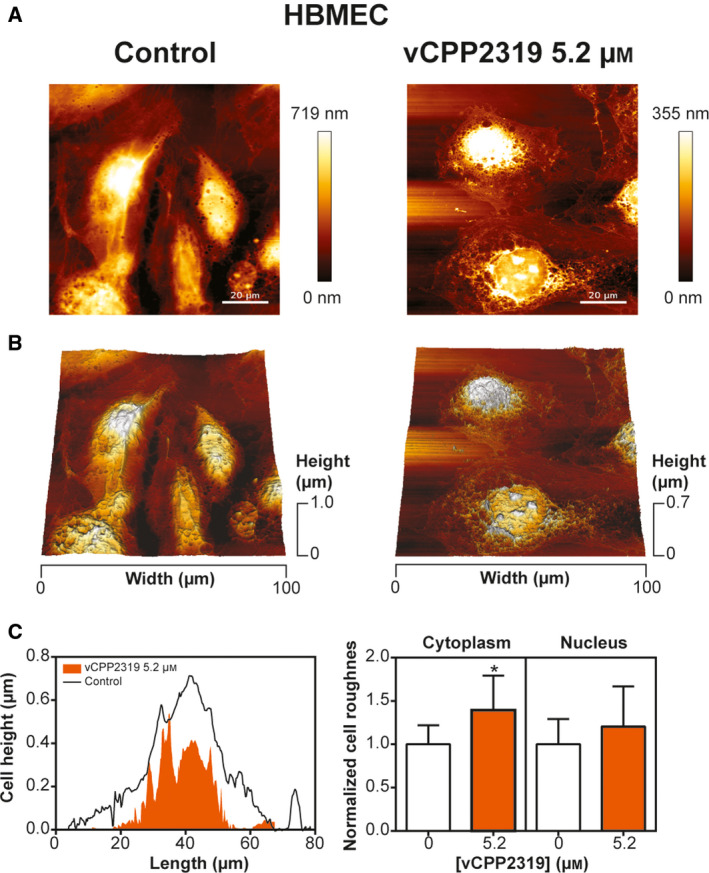
vCPP2319 effect on the morphology and topography of HBMEC. AFM was used to image untreated and treated HBMEC. Representative height images and 3D projections are shown (A and B, respectively). Representative height profiles and normalized cell roughness (n = 3 for control and n = 2 for cells treated with vCPP2319) are also represented (C). Error bars refer to the standard deviation. One‐way ANOVA followed by Tukey’s multiple comparison test was applied to infer on data significance. *P‐value ≤ 0.05. Scale bar represents 20 μm.
