
Figure 4.
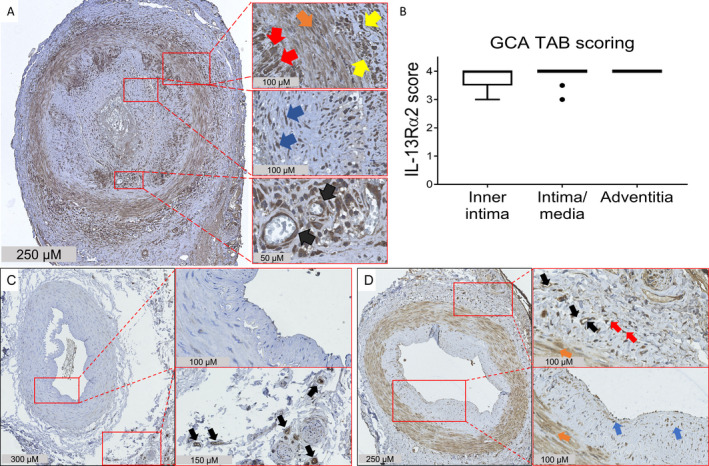
Elevated expression of interleukin‐13 receptor α2 (IL‐13Rα2) in the inflamed temporal arteries of patients with giant cell arteritis (GCA). A, Temporal artery biopsy (TAB) specimens from treatment‐naive GCA patients were stained for IL‐13Rα2. Expression of IL‐13Rα2 was detected in all 3 layers of the vessel wall. Right panels are higher‐magnification views of the boxed areas, showing expression of IL‐13Rα2 by macrophages (red arrows), vascular smooth muscle cells (orange arrow), infiltrating leukocytes (yellow arrows), fibroblasts (blue arrows), and endothelial cells (black arrows). B, IL‐13Rα2 expression in the vessel layers of GCA temporal artery biopsy specimens was scored semiquantitatively. The box represents the 25th to 75th percentiles. The line outside the box represents the 75th percentile plus 1.5 times the interquartile range (IQR). Horizontal lines represent the median. Circles indicate points outside the 25th or 75th percentile plus 1.5 times the IQR. C, Temporal artery biopsy specimens from individuals without GCA or polymyalgia rheumatica were stained for IL‐13Rα2. Right panels are higher‐magnification views of the boxed areas, showing minimal expression of IL‐13Rα2 in the medial vascular smooth muscle layer and the lumen, and stronger expression in the vasa vasorum endothelial cells (black arrows). D, Temporal artery biopsy specimens from patients with positron emission tomography–proven GCA were stained for IL‐13Rα2. Strong expression of IL‐13Rα2 was detected in all 3 layers of the vessel wall. Right panels are higher‐magnification views of the boxed areas, showing expression of IL‐13Rα2 by endothelial cells (black arrows), vascular smooth muscle cells (orange arrows), and presumably resident dendritic cells (red arrows) and fibroblasts (blue arrows). Results are representative of 12 samples in A, 2 samples in C, and 3 samples in D.