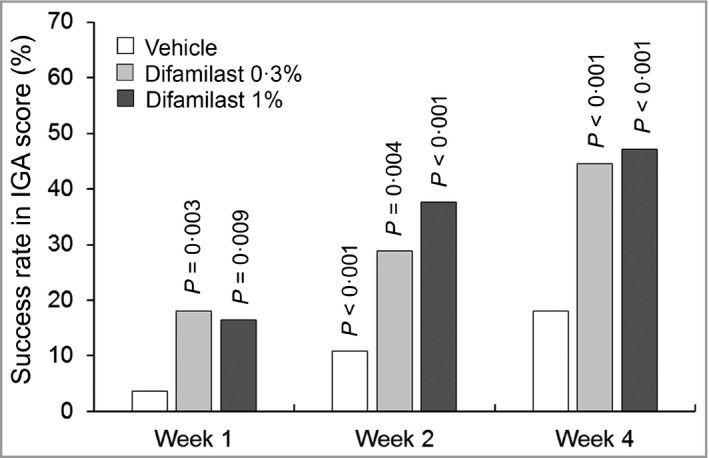
Figure 2.

Success rate in Investigator’s Global Assessment (IGA) score. The data represent the percentage of patients achieving an IGA score of 0 or 1 with an improvement of at least two grades at each timepoint. All timepoints: vehicle, n = 83; difamilast 0·3%, n = 83; difamilast 1%, n = 85. P‐values are for the comparison between each difamilast group and the vehicle group.
