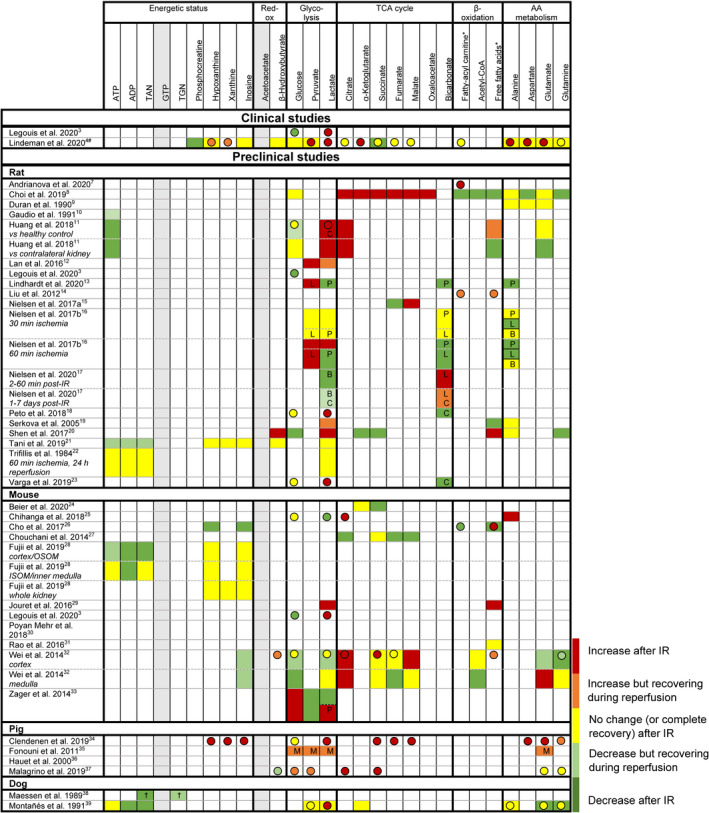
FIGURE 2.

Relative differences in renal tissue (boxes) and blood (spheres, note: often systemic if no data on kidney‐specific samples) metabolite levels between control kidneys (healthy/intact control, sham‐surgery control, or contralateral kidney: see Table 2) and kidneys after ischemia reperfusion (IR). If no control data were available, data were excluded. Metabolites marked in grey were not reported for tissue or blood samples in any of the preclinical studies. Red = increase after IR. Orange = increase but recovering during reperfusion (requires multiple samples during reperfusion). Yellow = no change (or complete recovery) after IR. Light green = decrease but recovering during reperfusion (requires multiple samples during reperfusion). Green = decrease after IR. TAN: total adenine nucleotides (ATP+ADP+AMP). TGN: total guanine nucleotides (GTP+GDP+GMP). *: variety of fatty acids, results on overall trend. #: additional data on tissue levels are reported in the supplementary data, but no formal statistical evaluation was performed. OSOM: outer stripes of outer medulla. ISOM: inner stripes of outer medulla. †: ischemia time dependent. P: metabolite/pyruvate ratio. L: metabolite/lactate ratio. B: metabolite/bicarbonate ratio. C: in control (sham‐operated animal or contralateral kidney), metabolite levels showed similar dynamics following surgery. M: measured using microdialysis
