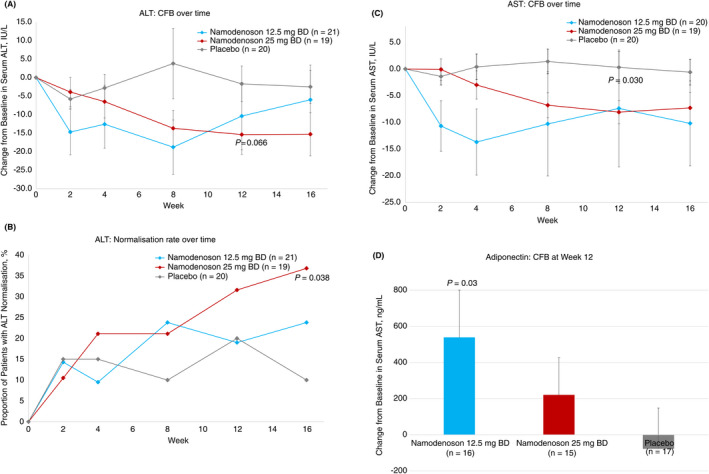
FIGURE 2.

Changes from baseline (CFB) in inflammation‐related parameters. A, CFB in ALT levels over time. B, The proportion of patients achieving normalisation of ALT levels over time. C, CFB in AST levels over time. D, CFB in adiponectin levels at Week 12. Error bars represent SE P‐values for ALT and AST CFB were derived from ad hoc analyses
