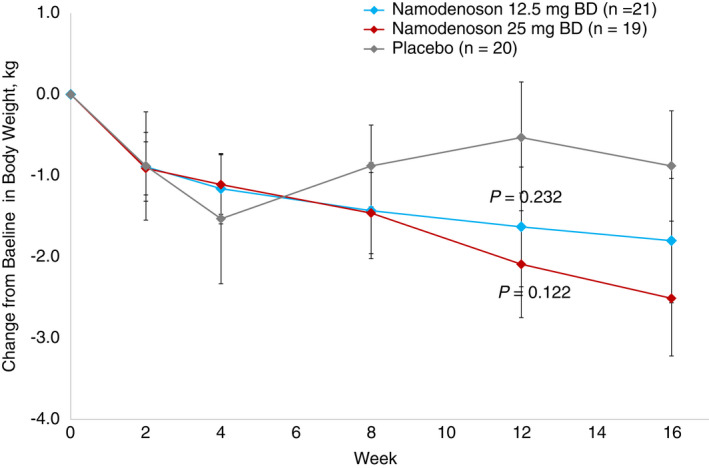
FIGURE 4.

CFB in body weight with namodenoson treatment over time. Error bars represent SE P‐values were derived from ad hoc analyses

CFB in body weight with namodenoson treatment over time. Error bars represent SE P‐values were derived from ad hoc analyses