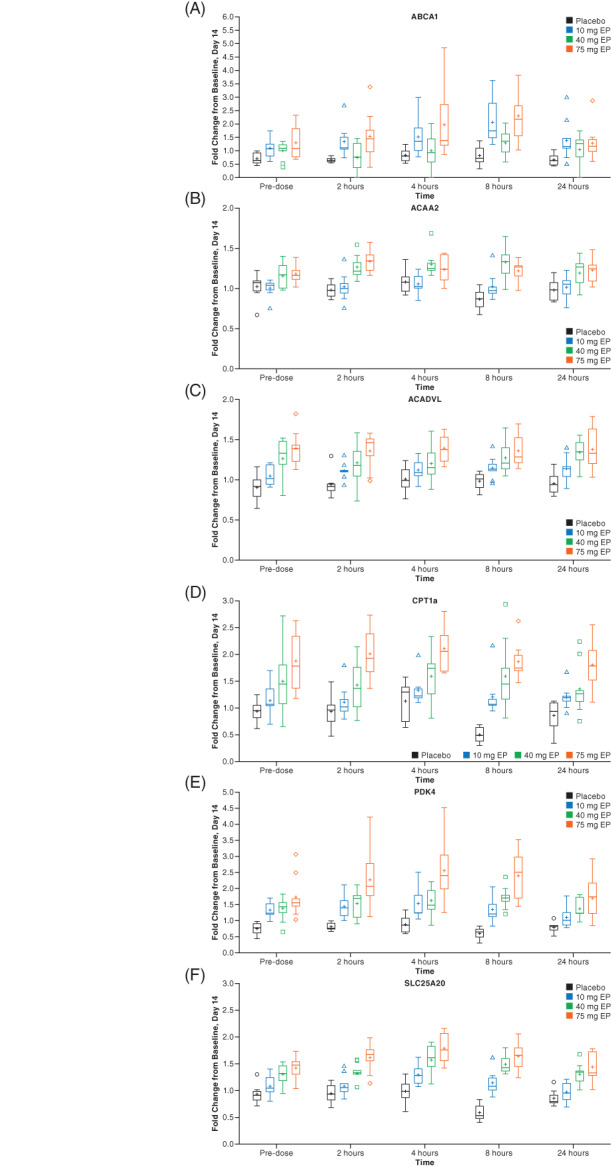
FIGURE 2.

Gene expression graphs for six PPARδ target genes with multiple ascending once‐daily doses of ASP0367 during part 2, day 14. The boxplots for fold change from baseline to day 14 are shown for ABCA1 (A), ACAA2 (B), ACADVL (C), CPT1a (D), PDK4 (E), and SLC25A20 (F). There were eight participants in the placebo group and nine participants in each ASP0367 group at each of the doses administered 10, 40, and 75 mg. Abbreviation: EP, extemporaneously prepared
