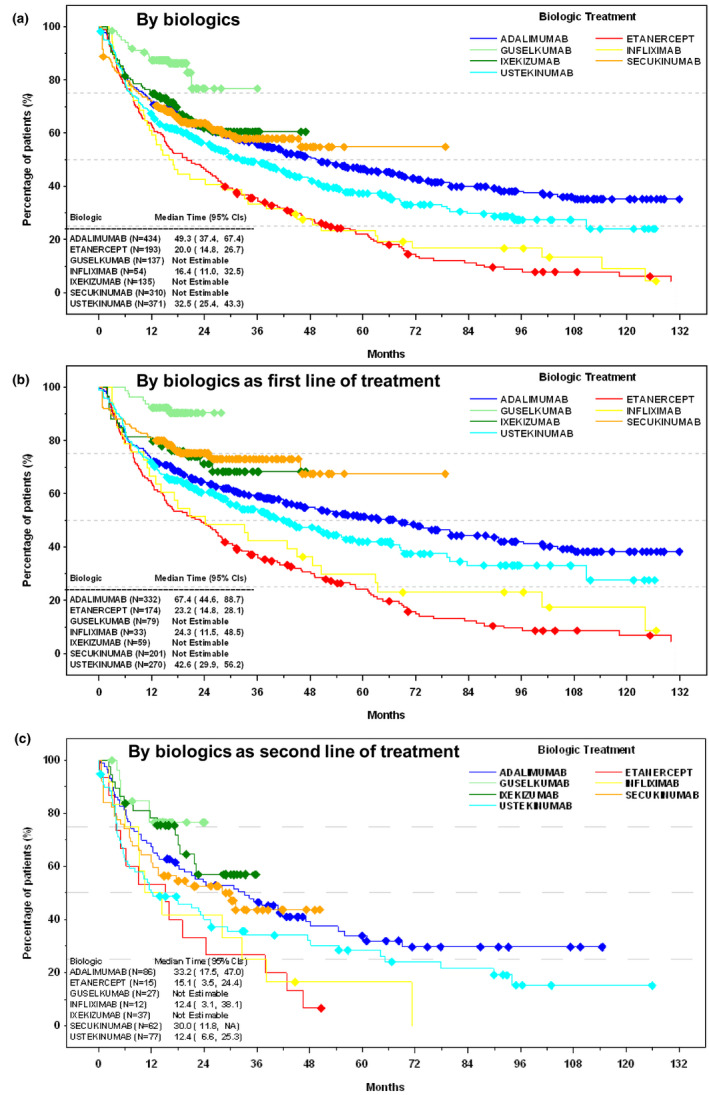
FIGURE 1.

Time to treatment change, including switching, discontinuation, dose escalation, and interval change (both increasing and decreasing). (a) By biologics. (b) By biologics as first line of treatment. (c) By biologics as second line of treatment. Diamond symbols indicate censored patients; treatment for these patients was ongoing at the time of chart review, and time to treatment change was not estimable. Brodalumab is not shown due to the low number of patients using it (n = 4). CI, confidence interval; NA, not applicable.
