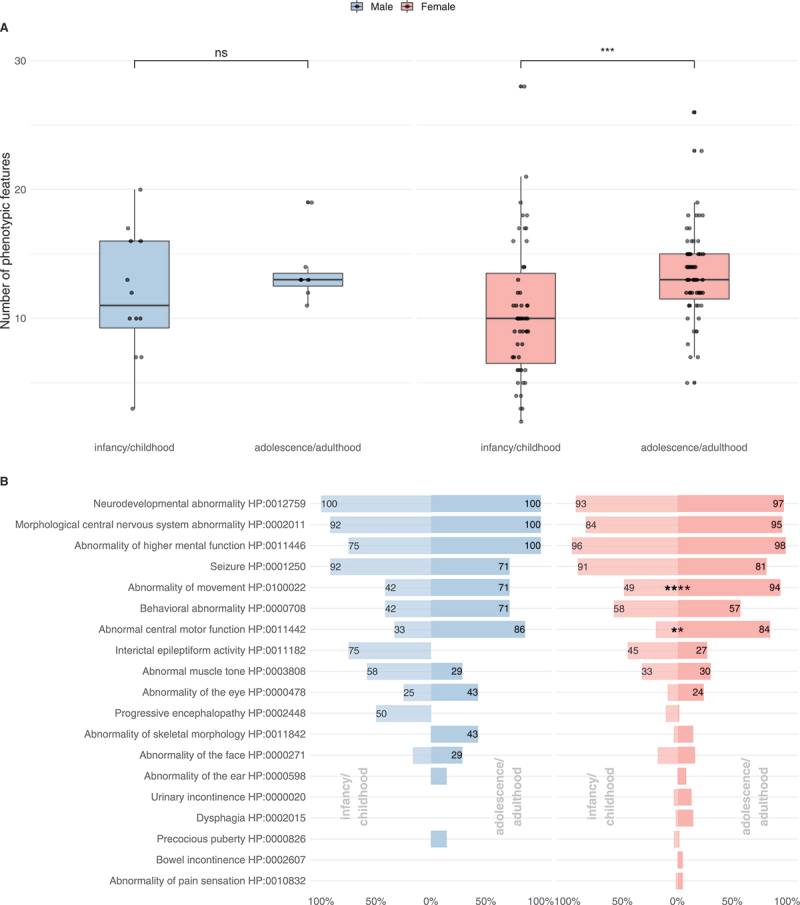
Figure 3.

Subgroup analysis of the phenotypic spectrum of WDR45-related NDD. A total of 19 males (ninfancy/childhood = 12, nadolescence/adulthood = 7) and 118 females (ninfancy/childhood = 55, nadolescence/adulthood = 63) were examined. (A) Number of phenotypic features per individual with respect to 63 non-redundant Human Phenotype Ontology terms. Statistic testing was done using the Mann-Whitney U test. P values were adjusted for multiple hypothesis testing using the Benjamini-Hochberg procedure. ns = not significant. (B) Frequencies of Human Phenotype Ontology ancestor terms derived phenotypic features. Frequencies greater than 20% were printed on the respective bars. Statistical testing was done using Pearson’s Chi-squared test or Fisher’s exact test (in case of less than 5 counts per subgroups). P values were adjusted for multiple hypothesis testing using the Benjamini-Hochberg procedure.
