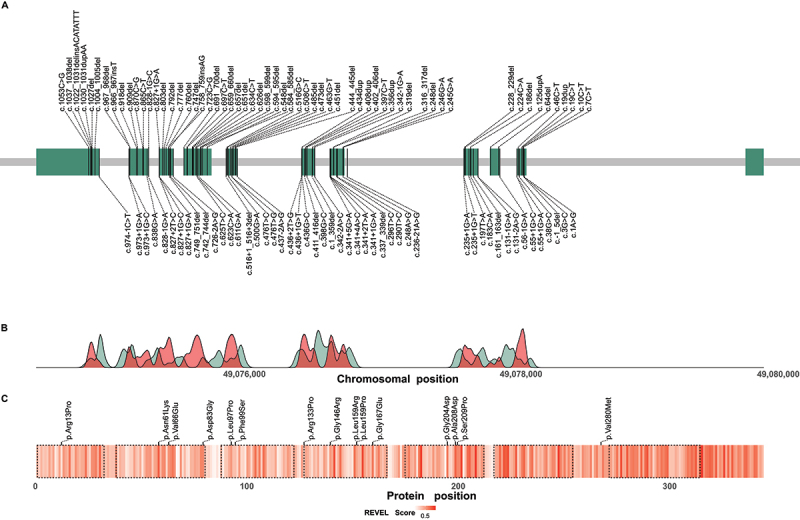
Figure 5.

Distribution of reported disease-causing variants in WDR45. (A) Chromosomal region of WDR45 including 11 exons illustrated as green rectangles. Chromosomal positions of disease-causing variants are indicated by vertical lines. Variants resulting in frameshifts and premature stop codons are plotted above and the remaining variants below the gene. (B) Densities of pathogenic WDR45 variants from the literature (red) and benign variants from the gnomAD genomes database (green) according to their chromosomal position. Densities show mainly reciprocal distributions suggesting little tolerance in the healthy population toward variation in regions of pathogenic variant enrichment. (C) Heat map visualization of variant effect prediction score values for all possible missense variants according to their position of amino acid exchange within the WDR45 protein sequence. Arithmetic means of REVEL score values at any protein position are color-coded. WD repeat domains are highlighted by dashed lines. Reported WDR45 missense variants are shown as black ticks. Accumulation of high score values in the C-terminal section of WDR45 suggest a functional relevance of this region with low tolerance to missense variation.
