
Figure 2.
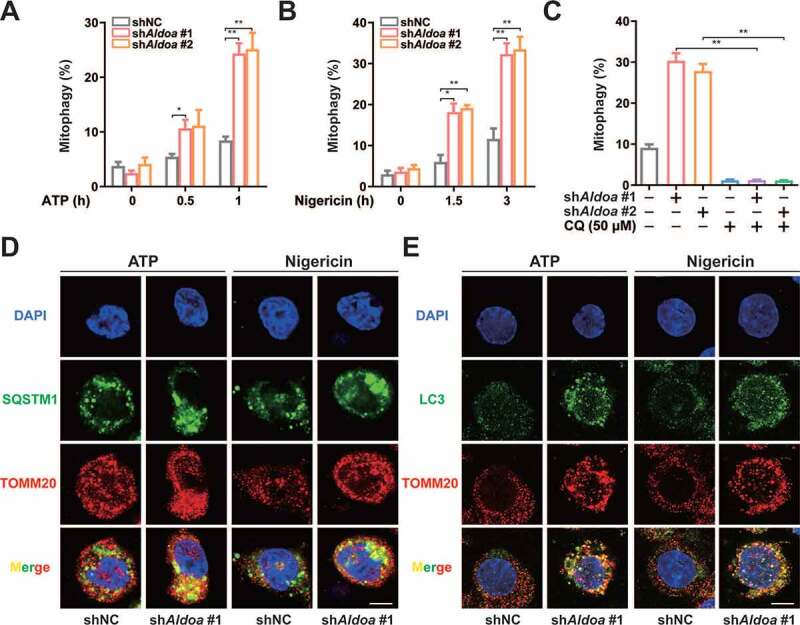
ALDOA limited PRKN-dependent mitophagy. (A) FACS analysis LPS-primed J774A.1 cells stably expressing shRNA against Aldoa and mito-Keima, stimulated with or without ATP (5 mM) for 0.5 h and 1 h. (B) FACS analysis LPS-primed J774A.1 cells stably expressing shRNA against Aldoa and mito-Keima, stimulated with or without nigericin (4 μM) for 1.5 h and 3 h. (C) FACS analysis LPS-primed J774A.1 cells stably expressing shRNA against Aldoa and mito-Keima treated with CQ (50 μM), stimulated with nigericin (4 μM) for 3 h. (D and E) Intracellular distribution of SQSTM1 (D) or LC3 (E) and mitochondria (TOMM20) in LPS-primed J774A.1 cells stably expressing shRNA against Aldoa, stimulated with ATP (5 mM) for 1 h, nigericin (4 μM) for 3 h, examined by confocal microscopy. Scale bars: 10 µm. Data are presented as mean ± SD (n = 3). *P < 0.05, **P < 0.01.