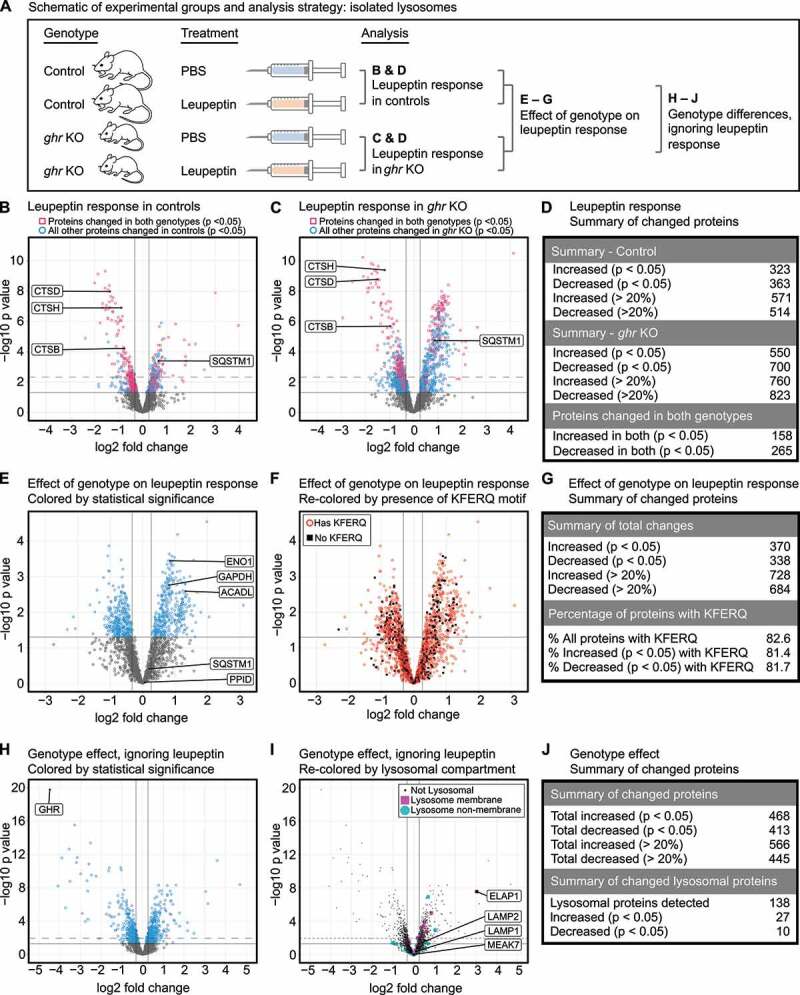
Figure 1.

ghr KO and control lysosomes have distinct compositions and targetomes. (A) Schematic of the experimental groups and analysis. (B) Volcano plot showing the response to leupeptin in lysosomes from control mice. Proteins that are also significantly changed in ghr KO with identical directionality are shown as red squares. All other significantly changed proteins in controls are shown as blue circles. (C) Volcano plot showing the response to leupeptin in lysosomes from ghr KO mice. Proteins that are also significantly changed in controls with identical directionality are shown as red squares. All other significantly changed proteins in ghr KO are shown as blue circles. (D) Summary table for numbers of proteins changed in response to leupeptin in control and ghr KO lysosomes. (E) Volcano plot for a 2-factor analysis of the effects of the ghr KO genotype on the lysosomal leupeptin response. Proteins more enriched in ghr KO than in controls, in response to leupeptin, will have a positive log2 fold change. Proteins that are equally changed in both genotypes in response to leupeptin will have a near-zero value. (F) The volcano plot shown in (E), re-colored and relabeled to indicate proteins with at least one KFERQ motif (canonical, phosphorylation activated, or acetylation activated). (G) Summary table for numbers of proteins changed as determined by the 2-factor analysis. (H) Volcano plot showing the contribution of genotype to differences in lysosomal proteins, ignoring leupeptin as a variable. (I) The volcano plot shown in (H), re-colored to indicate proteins that have a lysosomal function. (J) Summary table for numbers of proteins changed between the ghr and control genotypes. For all volcano plots, dark vertical lines indicate a fold-change of change of 20%. Dark, solid horizontal lines indicate a threshold of p = 0.05. Where applicable, dashed horizontal lines indicate a false-discovery adjusted threshold of p = 0.05. Each of the four experimental groups shown in (A) has lysosomal samples from a total of 6 mice (3 of each sex).
