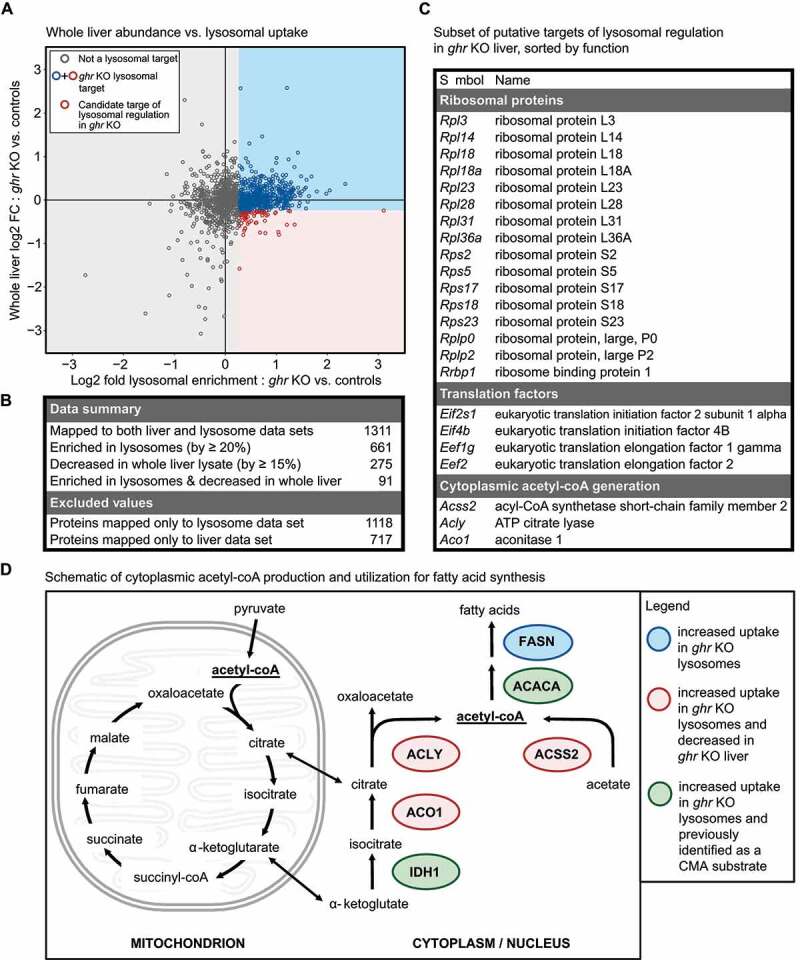
Figure 3.

Identification of a subset of the ghr KO proteome putatively regulated by lysosomal degradation. (A) Scatter plot of whole liver log2 fold change against log2 fold enrichment in ghr KO lysosomes. Red circles represent proteins with > 20% enrichment in ghr KO lysosomes in response to leupeptin, and a decrease of >15% in whole liver lysates. Blue circles indicate proteins with > 20% enrichment in ghr KO lysosomes in response to leupeptin, but without a decrease of >15% in whole liver lysates. All remaining proteins are shown as gray circles (B) Summary table of proteins changed in liver and liver lysosomes. The numbers of proteins excluded from the analysis are also listed. (C) Table summarizing which of the candidate targets of lysosomal regulation in ghr KO mice are ribosomal constituents, translation regulation factors, or enzymes for cytoplasmic acetyl-coA production. (D) Schematic of cytoplasmic acetyl-coA production and utilization for fatty acid synthesis, with lysosomal targets highlighted.
