Figure 9.

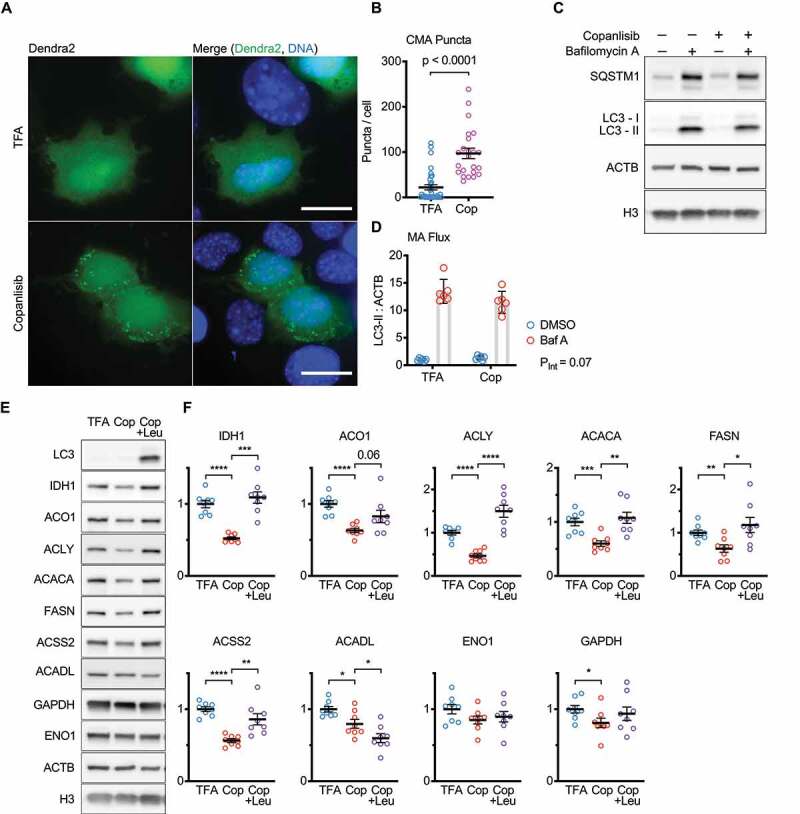
CMA is sufficient to regulate the abundance of nucleocytosolic acetyl-coA and fatty acid production enzymes in AML12 hepatocytes. (A) Z-projections of images of Dendra2 CMA reporter in AML12 cells treated with 100 nM copanlisib, or TFA solvent control for 10 h. (B) Dendra2 puncta per cell, from 4 frames from 3 separate experiments. (C) Western blots showing macroautophagic flux in AML12 cells treated with 100 nM copanlisib, or TFA solvent control for 10 h. (D) quantification of LC3-II flux, pertinent to (C); six replicates are shown on the graph. (E) Western blots for indicated proteins in lysates from AML12 cells treated for 48 h with 0.0005% TFA (solvent control), 100 nM copanlisib, or 100 nM copanlisib + leupeptin/ammonium chloride. (F) Quantifications of western blots shown in (E). All proteins are adjusted for loading, using ACTB as a loading control. For (E-F) each experiment was repeated eight times, with individual values shown on the graphs. Black bars indicate means and SEM. p value shown in (B) is from a Kolmogorov–Smirnov test. PINT, shown in (D) is an interaction term p-value from a 2-way ANOVA. p values shown on graphs in (F) are derived by unpaired t-tests with Welch’s correction for unequal SDs. In (F), p-values are replaced with asterisks to save space: *p < 0.05, **p < 0.01, ***p < 0.001. Scale bars: 20 μm.
