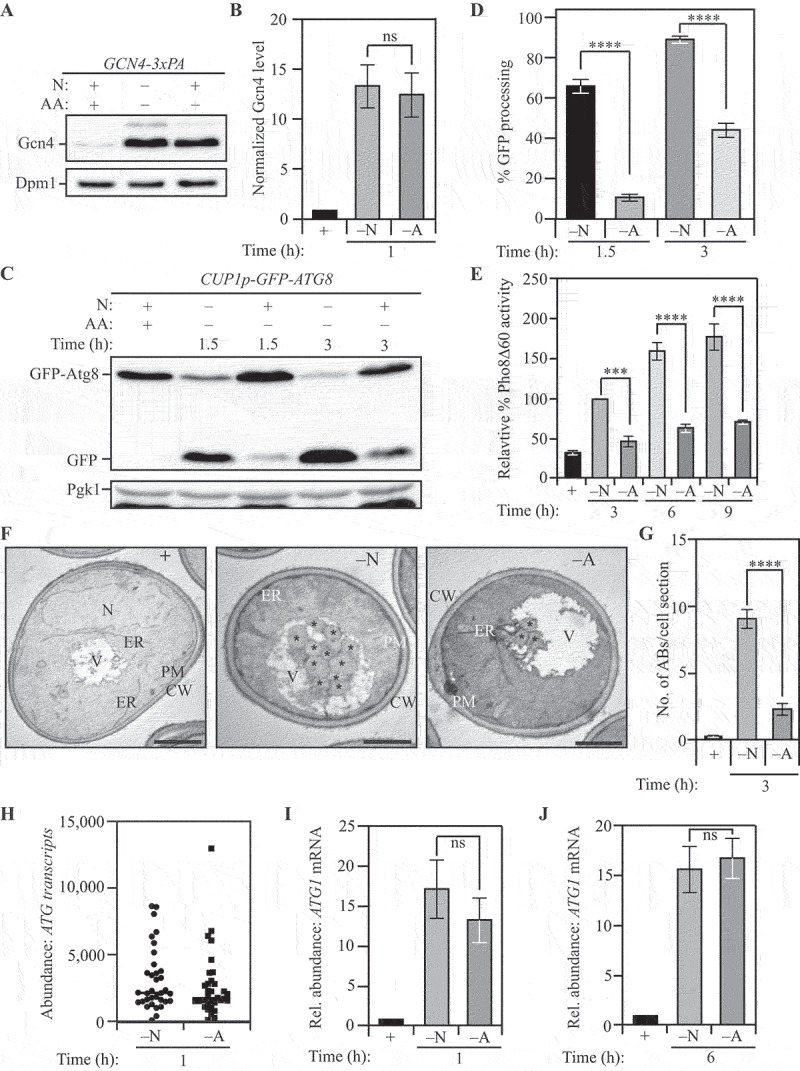
Figure 1.

Differential autophagy flux during distinct nutrient stresses is not determined by ATG transcription. (A) Gcn4 expression is upregulated during both nitrogen and amino acid starvation: WT (SEY6210) cells with C-terminally 3x-PA tagged Gcn4 were harvested in nutrient-replete conditions or after starvation for the indicated time and examined by western blot. Gcn4 was detected using the anti-PA antibody and Dpm1 was used as a loading control. (B) Densitometric analysis for (A) from three independent biological replicates. (C) The GFP-Atg8 processing assay demonstrates increased autophagy flux during nitrogen starvation relative to amino acid starvation: WT (WLY176) cells with integrated CUP1p-GFP-ATG8 were harvested in nutrient-replete conditions or after starvation for the indicated times and assessed by western blot. The appearance of free GFP indicates autophagy flux. Pgk1 was used as a loading control. (D) Densitometric analysis of (C) from three independent biological replicates. (E) Autophagy flux is higher during nitrogen starvation compared to amino acid starvation as assessed by the Pho8Δ60 assay: WT (WLY176) cells were harvested in nutrient-replete conditions or after starvation for the indicated times and Pho8Δ60 enzyme activity was measured by colorimetry. An increase in Pho8Δ60 activity indicates increased autophagic flux. Data from three independent biological replicates. (F) Autophagosome formation is more frequent during nitrogen starvation compared to amino acid starvation: WT (SEY6210) pep4∆ vps4∆ cells were harvested in nutrient-replete conditions or after starvation for 3 h. The cells were fixed, stained and ultrastructural analysis was used to visualize the number of ABs. Scale bar: 1 µm. (G) Quantification of the number of ABs from 100 randomly selected cell profiles from two independent biological replicates. (H) RNA-Sequencing reveals similar abundance of ATG transcripts during nitrogen and amino acid starvation: DESeq2 analysis of the ATG transcriptome during nitrogen and amino acid starvation. The plot represents the mean of three independent biological replicates from WT (SEY6210) cells. (I) and (J) There is a similar abundance of ATG1 transcript in cells subjected to nitrogen or amino acid starvation: qRT-PCR detection of ATG1 mRNA in WT (SEY6210) cells after 1 h (I) or 6 h (J) of starvation. ALG9 was used as a reference gene for normalization. Data from three independent biological replicates. Data in (B), (D), (E) and (G-J) represent mean ± SEM from the indicated number of replicates. Statistical analysis for (B), (G), (I) and (J) was carried out using unpaired Student’s t-test whereas (D) and (E) were analyzed using one-way analysis of variance (ANOVA). Multiple comparisons were carried out using Tukey’s multiple comparisons test. *p < 0.05, **p < 0.005, ***p < 0.001, ****p < 0.0001 ns: not significant.
