Figure 5.

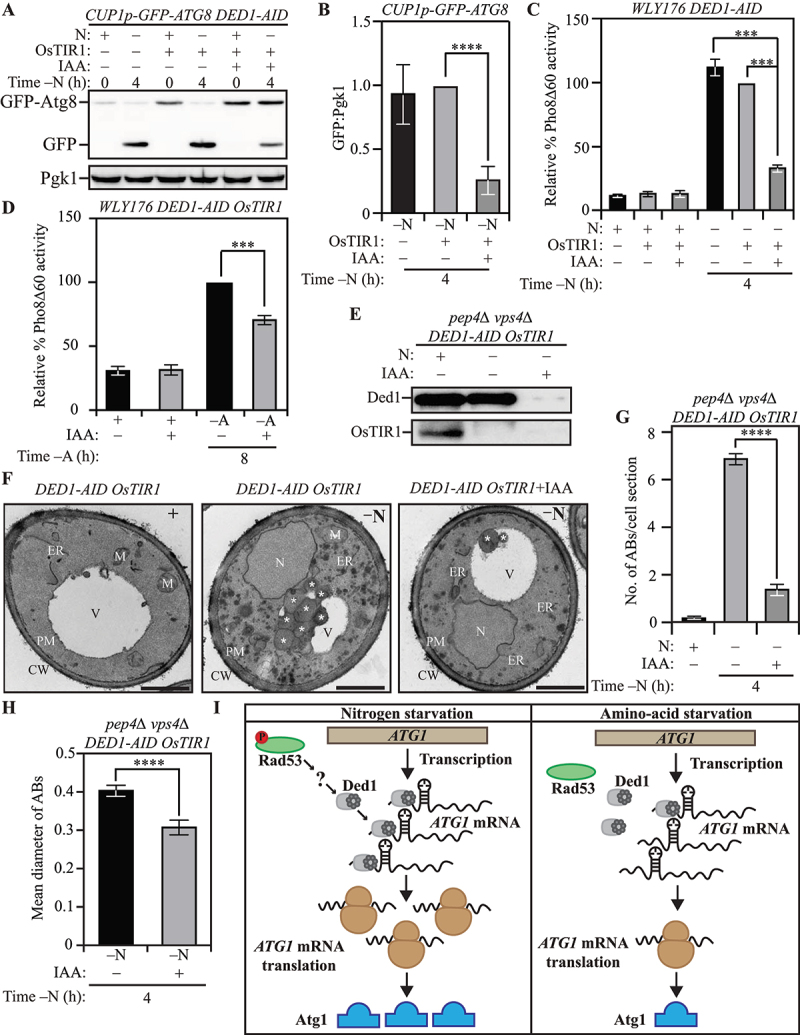
Ded1 regulates autophagy in yeast. (A) The acute loss of Ded1 causes a reduction in autophagy flux during nitrogen starvation as assessed by the GFP-Atg8 processing assay: WT (WLY176) CUP1p-GFP-ATG8 DED1-AID cells lacking OsTIR1 and WT (WLY176) CUP1p-GFP-ATG8 DED1-AID OsTIR1 cells were harvested during nutrient-replete conditions or after nitrogen starvation with or without IAA treatment and examined by western blot. The appearance of free GFP indicates autophagy flux. (B) Densitometric analysis of (A) from three independent biological replicates. (C) and (D) The acute loss of Ded1 reduces autophagy flux significantly more during nitrogen starvation than amino acid starvation as demonstrated by the Pho8Δ60 assay: WT (WLY176) CUP1p-GFP-ATG8 DED1-AID cells and WT (WLY176) CUP1p-GFP-ATG8 DED1-AID OsTIR1 cells were harvested during nutrient-replete and nitrogen-starvation (C) or amino-acid starvation (D) conditions and Pho8Δ60 enzyme activity was measured by colorimetry. An increase in Pho8Δ60 activity indicates increased autophagic flux. Data are from three independent biological replicates. (E) Degradation of Ded1-AID upon IAA treatment in SEY6210 pep4∆ vps4∆ DED1-AID OsTIR1 cells. (F-H) Defects in autophagosome formation during nitrogen starvation due to acute loss of Ded1: (F) SEY6210 pep4∆ vps4∆ DED1-AID OsTIR1 cells were harvested during nutrient-replete conditions or after 3-h nitrogen starvation with or without IAA treatment. The cells were fixed, stained and ultrastructural analysis was used to visualize the number and size of ABs. Scale bar: 1 µm. (G) Quantification of the number of ABs from 100 randomly selected cell profiles from two independent biological replicates. (H) Quantification of the diameter of ABs counted in (G). (I) Schematic depicting the proposed post-transcriptional regulation of ATG1 expression that regulates autophagy differentially between nitrogen and amino acid starvation. Data in (B-D), (G) and (H) represent mean ± SEM from the indicated number of replicates. Statistical analysis was carried out using one-way analysis of variance (ANOVA) Multiple comparisons were carried out using Tukey’s multiple comparisons test. *p < 0.05, **p < 0.005, ***p < 0.001, ****p < 0.0001 ns: not significant.
