
Figure 3.
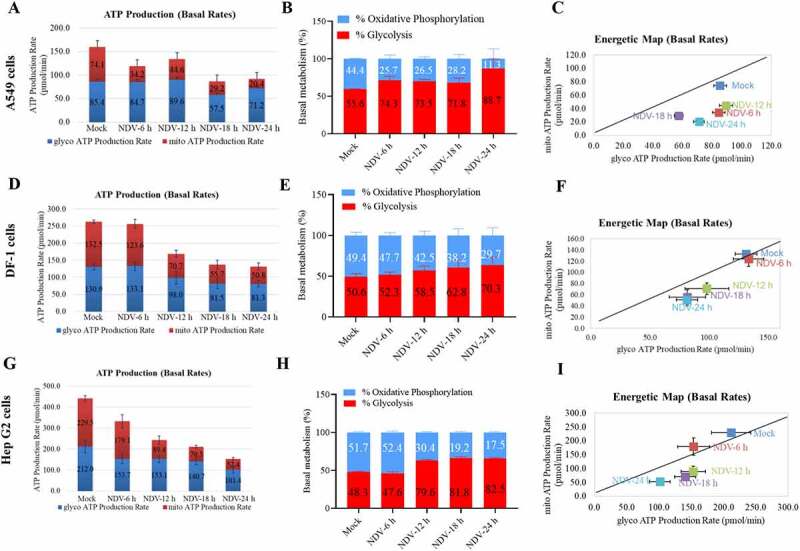
NDV reduces total ATP production, with a higher proportion of glycolysis-derived ATP. (A-C) Seahorse XF Real-time ATP rate analysis in A549 cells upon NDV infection at 6, 12, 18, and 24 hpi. Metabolic flux analysis on the Seahorse XF shows decrease in total ATP production in A549 cells compared to mock infection (A), with an increase proportion of ATP derived from glycolysis, decrease proportion of ATP derived from OXPHOS (B). Energetic map of the mitochondrial ATP production rate (mito-ATP) versus glycolysis ATP production rate (Glyco-ATP) (C). (D-F) Seahorse XF Real-time ATP rate analysis in DF-1 cells upon NDV infection at 6, 12, 18, and 24 hpi. Metabolic flux analysis on the Seahorse XF shows decrease in total ATP production in DF-1 cells at 6, 12, 18 and 24 hpi compared to mock infection (D), with an increase proportion of ATP derived from glycolysis, decrease proportion of ATP derived from OXPHOS (E). Energetic map of the mitochondrial ATP production rate (mito-ATP) versus glycolysis ATP production rate (Glyco-ATP) (F). (G-I) Seahorse XF Real-time ATP rate analysis in Hep G2 cells upon NDV infection at 6, 12, 18, and 24 hpi. Metabolic flux analysis on the Seahorse XF shows decrease in total ATP production in Hep G2 cells at 6, 12, 18, and 24 hpi compared to mock infection (G), with an increase proportion of ATP derived from glycolysis, decrease proportion of ATP derived from OXPHOS (H). Energetic map of the mitochondrial ATP production rate (mito-ATP) versus glycolysis ATP production rate (Glyco-ATP) (I). Data are mean ± SEM, all data are from three independent experiments.