
Figure 6.
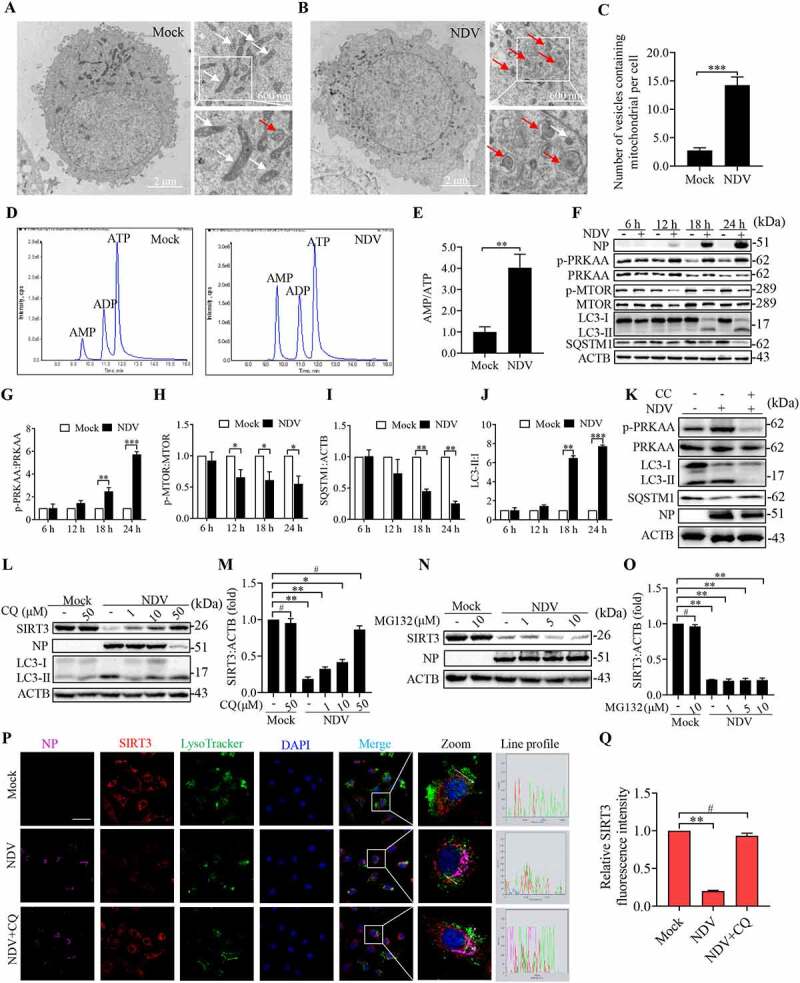
AMPK-MTOR axis regulated autophagy contributes to the degradation of SIRT3 during NDV infection. (A and B) A549 cells were either mock treated or infected with NDV Herts/33 strain at an MOI of 1. Electron microscopy images revealed the mitochondrial ultrastructure. In the zoomed images, typical elongated tubular mitochondria in mock cells and fragmented elliptic mitochondria engulfed with membrane-like vesicles in NDV- infected cells were observed. (C) Quantification of the mitophagosome-like vesicles per cell. Scale bar: 2 μm. (D) Adenylates AMP, ADP, and ATP were determined via HPLC following either mock treatment or NDV infection at 18 h. (E) AMP:ATP ratios in mock versus NDV-infected A549 cells. (F) p-PRKAA, PRKAA, p-MTOR, MTOR, LC3, SQSTM1, and ACTB protein levels were determined via western blot. (G-J) Quantification of p-PRKAA:PRKAA ratio, p-MTOR:MTOR ratio and quantification of SQSTM1, LC3-II:I ratio. (K) Western blot showing p-PRKAA, PRKAA, LC3 and SQSTM1 expression in NDV-infected cells (18 hpi) treated with AMPK inhibitors, CC. (L and M) A549 cells were either mock treated or infected with NDV Herts/33 strain at an MOI of 1. Western blot showing SIRT3 expression in NDV-infected cells (18 hpi) treated with autophagy inhibitors: CQ for the final 6 h. CQ was added at 1, 10, and 50 μM after NDV infection at an MOI of 1. Mock samples were treated in the presence or absence of CQ (50 μM) and quantification of SIRT3. (N and O) Treated with protease inhibitor MG132 for the final 6 h. MG132 was added at 1, 5, and 10 μM after NDV infection at an MOI of mock samples were treated in the presence or absence of MG132 (10 μM) and quantification of SIRT3. (P) Immunofluorescence of mock, NDV, and NDV+CQ (50 μM for the final 6 h) infected A549 cells stained for NP, SIRT3, and LysoTracker. (Q) Quantification of SIRT3 fluorescence intensity. White boxed regions in the panels are enlarged. Scale bar: 10 μm, Data are mean ± SEM, all data are from three independent experiments, ** p < 0.01, *** p < 0.001, # p > 0.05.