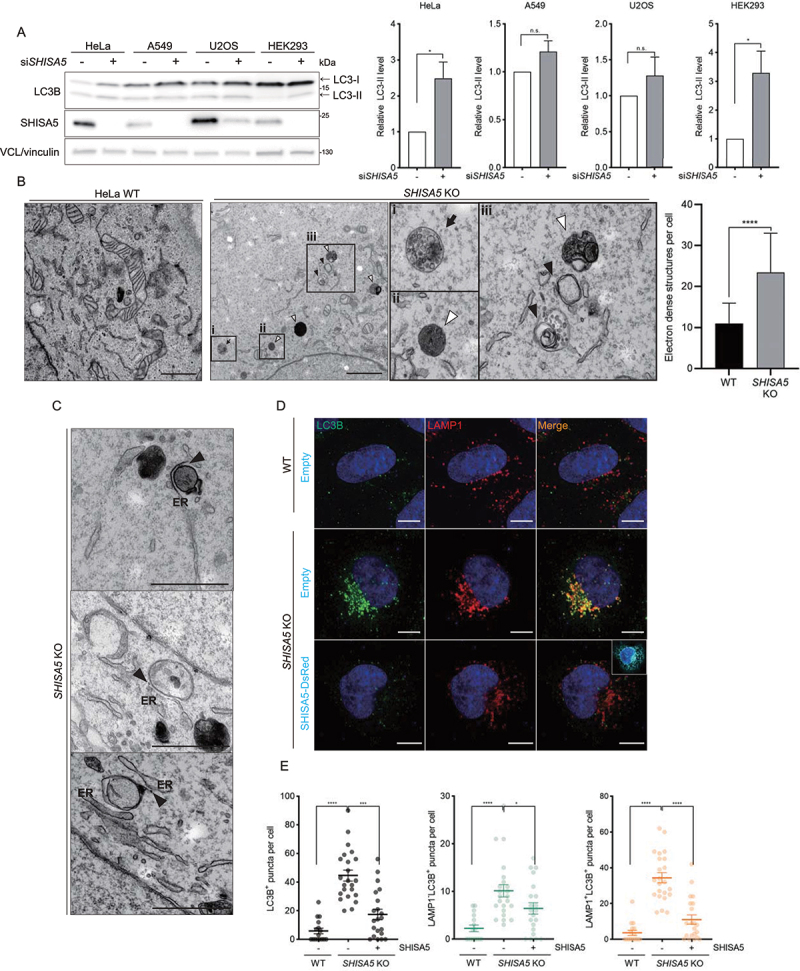
Figure 1.

SHISA5-depletion enhanced autophagy. (A) Left panel: western blot analysis of LC3 levels in HeLa, A549, U2OS, and HEK293 cells treated with control or SHISA5 siRNAs. Right panel: quantifications of LC3-II levels normalized to housekeeping protein level. The level of LC3-II in control siRNA transfected cells is set to 1.00. (B) TEM images of WT cells and SHISA5 KO HeLa cells. The boxed areas showing SHISA5 KO cells are magnified (boxes i, ii, and iii). White arrowheads point to autolysosomes or lysosomes. Black arrowheads indicate autophagosomal membrane. Black arrow indicates amphisomes. Quantifications of the electron-dense structures in the cells are shown in the right panel. The error bars indicate SD (n = 15 for WT and 19 for SHISA5 KO cells). See Figure S1B for the source images used for representative images. (C) Autophagosomal structures juxtaposed with ER. Black arrowheads indicate where ER and the autophagosomal membranes closely reside. See Figure S1C for the source images used for representative images. Scale bar: 1 μm. (D) WT and SHISA5 KO HeLa cells were transfected with empty vector or SHISA5-DsRed plasmid (cyan) for 48 h. Representative immunofluorescence images showing LC3B (green) and LAMP1 (red) staining. (E) Quantification of the LC3+ particles (left panel), LAMP1− LC3+ particles (middle panel), and LAMP1+ LC3+ particles (right panel) in the images performed using ImageJ. The error bars indicate SEMs (n = 16–23). Scale bar: 10 μm.
