Figure 3.

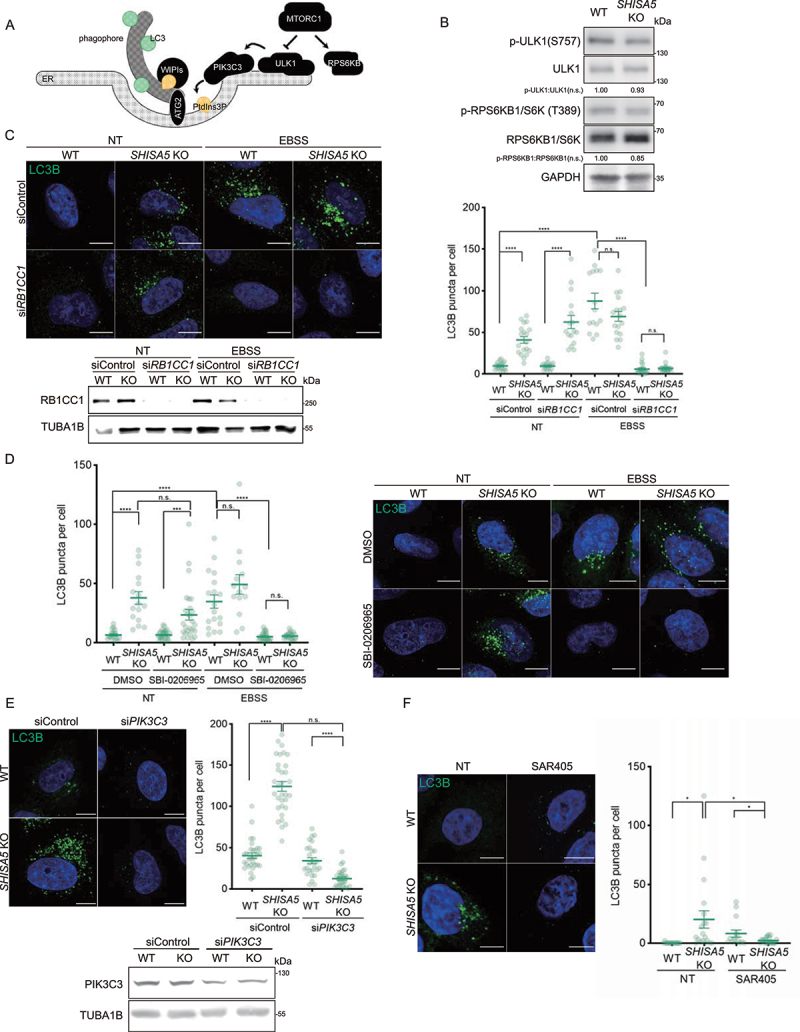
The loss of SHISA5 enhanced basal autophagy in a PtdIns3K-C1-dependent manner. (A) Schematic diagram depicting the genetic hierarchy of the early stage in autophagosome biogenesis at ER membrane. (B) Immunoblot analysis of phospho-ULK1 S757 (MTORC1 phosphorylation site), ULK1, phospho-RPS6KB1 T389 (MTORC1 phosphorylation site), RPS6KB1, LC3B, and TUBA1B in WT and SHISA5 KO HeLa cell lysates. Quantifications of band intensity from three independent experiments are noted. (C) Upper-left panel: representative immunofluorescence images of LC3B (green) in WT and SHISA5 KO HeLa cells. Cells were transfected with control or RB1CC1 siRNA and then incubated in complete medium (NT) or EBSS for 2 h. Lower-left panel: RB1CC1 knockdown efficiency was confirmed by western blot. Right panel: the number of LC3B puncta per cell was quantified (n = 15–22). (D) Right panel: representative immunofluorescence images of LC3B (green) in WT and SHISA5 KO HeLa cells. Cells were treated with DMSO or 50 μM of SBI-0206965 for 2 h in either complete medium (NT) or EBSS. Left panel: the LC3B puncta per cell were quantified (n = 13–27). (E) Upper-left panel: representative immunofluorescence images of WT and SHISA5 KO HeLa cells stained for LC3B (green) following transfection with control or PIK3C3 siRNA. Upper-right panel: the LC3B puncta per cell were quantified (n = 31–35). Lower panel: PIK3C3 knockdown efficiency was confirmed by western blot. (F) Left panel: representative immunofluorescence images of WT and SHISA5 KO HeLa cells stained for LC3B (green) following DMSO or SAR405 (1 μM) treatment for 2 h. Right panel: the LC3B puncta per cell were quantified (n = 15–21). All scale bars: 10 μm.
