FIGURE 4.
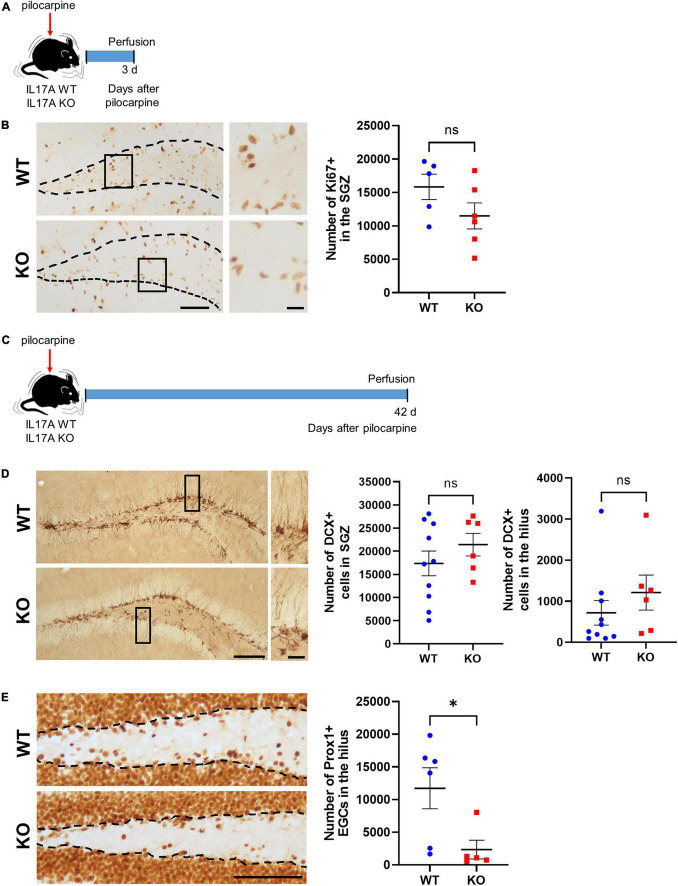
IL-17A deficiency in mice ameliorates seizure-induced aberrant hippocampal neurogenesis. (A) Timeline showing the experimental design. (B) Representative microscope images and a graph showing immunohistochemistry for Ki67. The rectangles are magnified in the right column. The inner edge of the granule cell layer is indicated as dotted lines. Ki67-immunoreactive cells in the subgranular zone (SGZ) were comparable between IL-17A WT and KO groups. Scale bar = 100 μm for low magnified images, 20 μm for higher magnified images. n = 5 (WT) and n = 6 (KO). Student’s unpaired t-test, p = 0.149, t(9) = 1.576. (C) Timeline showing the experimental design. (D) Representative microscope images and graphs showing immunohistochemistry for doublecortin (DCX). The rectangles are magnified in the right column. Scale bar = 100 μm for low magnified images, 20 μm for higher magnified images. n = 10 (WT) and n = 6 (KO). Detailed statistics are as follows. SGZ: Student’s unpaired t-test, p = 0.323, t(14) = 1.025; hilus: Mann–Whitney U-test, p = 0.141, U = 16,000. (E) Representative microscope images and a graph showing immunohistochemistry for prospero homeobox 1 (Prox1). The inner edge of the granule cell layer is indicated as dotted lines. Prox1-immunoreactive cells in the hilus were markedly reduced in IL-17A KO mice. Scale bar = 100 μm. n = 6 (WT) and n = 5 (KO). Mann–Whitney U-test, p = 0.017, U = 2,000. Data are presented as mean ± SEM. *p < 0.05, NS, not significant.

