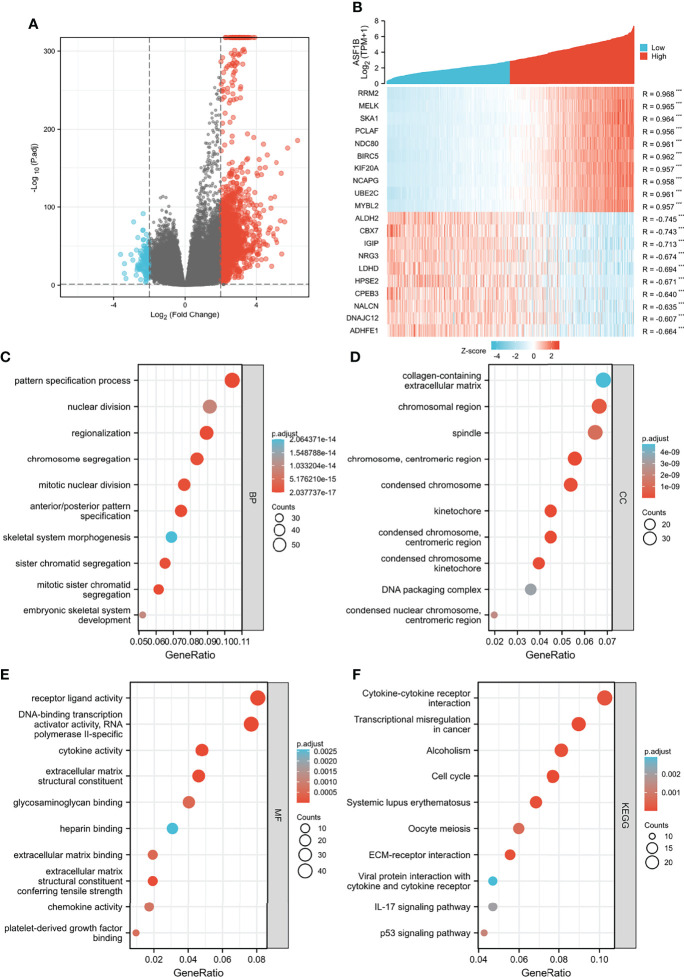
Figure 5.
Functional enrichment analysis for ASF1B expression in glioma patients from the TCGA database. (A) Volcano Plot of differentially expressed genes (DEGs) screened based on ASF1B expression. (B) The top 10 positively correlated genes and the top 10 negatively correlated genes cotranscript with ASF1B in gliomas. (C–F) Enrichment analysis showed the biological processes (BP) (C), cellular components (CC) (D), molecular function (MF) (E), and KEGG pathway analysis (F) of DEGs screened based on ASF1B expression. ***p <0.001.

