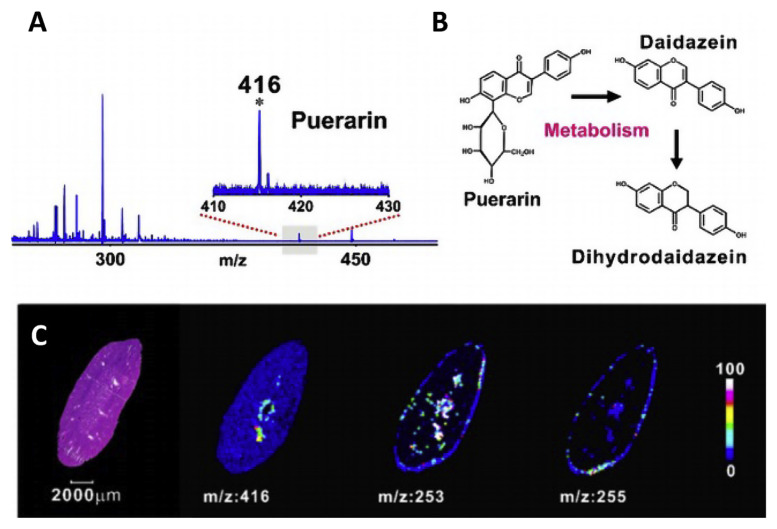
Fig. 5.
MSI of puerarin and its metabolites in rat kidney. (A) MALDI mass spectrum (negative-ion mode) of mouse serum after intraperitoneal administration of puerarin. Inset: Zoomed-in view of the spectrum in m/z 410–430, characteristic peak of puerarin: [M – H] at m/z 416. (B) Metabolic pathways showing puerarin and its two metabolites, (C) MALDI-MS images of the drug and its metabolites (puerarin, m/z: 416; daidzein, m/z: 253; and dihydrodaidzein, m/z: 255) in a kidney tissue slice with an optical micrograph of an H&E-stained consecutive slice as a reference. The color bar encodes the signal intensities of the three small molecules in MSI. Reproduced with permission from Ref. [52].

