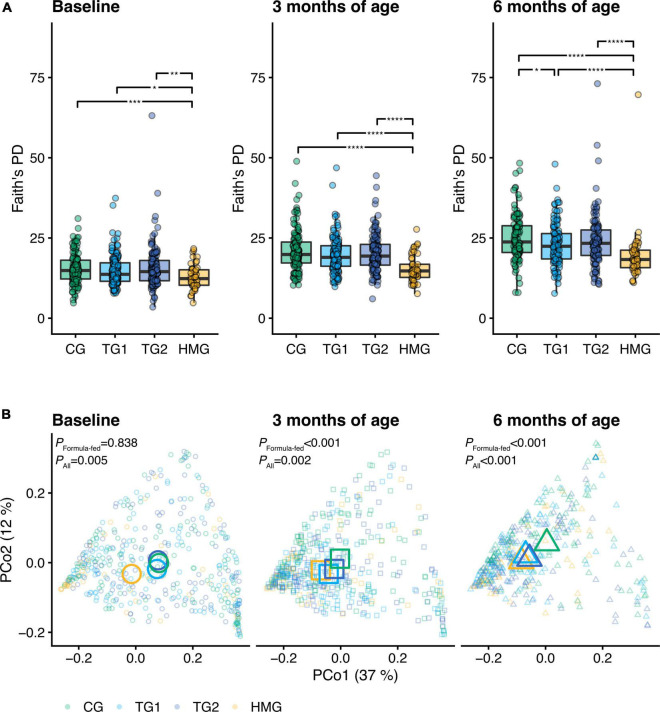
FIGURE 2.
(A) Alpha diversity (Faith’s phylogenetic diversity) of the gut microbiota of the infants in the four feeding groups at each timepoint (baseline left, 3 months of age center, 6 months of age right). Box plots show the median and 25th and 75th percentiles with Tukey whiskers. Within each timepoint, all feeding groups were compared pairwise (Dunn’s test), and significant differences are highlighted with significance bars. *P < 0.05, **P < 0.01, ***P < 0.001, ****P < 0.0001. (B) Principal coordinates analysis (PCoA) based on weighted UniFrac distance. Feeding groups are color-coded and faceted by timepoint. Individual data points are shown, with the mean (centroid) of each group indicated as a larger symbol. The x- and y-axis labels indicate the microbial variance explained by the first two principal coordinates. P-values for permutational multivariate analysis of variance (PERMANOVA) using feeding group as explanatory variable are shown for all infants and the subset of formula-fed infants at each visit. At baseline/3/6 month of age, CG, n = 135/135/111; TG1, n = 140/138/113; TG2, n = 136/140/117; HMG, n = 50/55/50. CG, control group; TG1, test group 1 (1.5 g HMOs/L); TG2, test group 2 (1.5 g HMOs/L); HMG, human milk-fed group; HMOs, human milk oligosaccharides.

