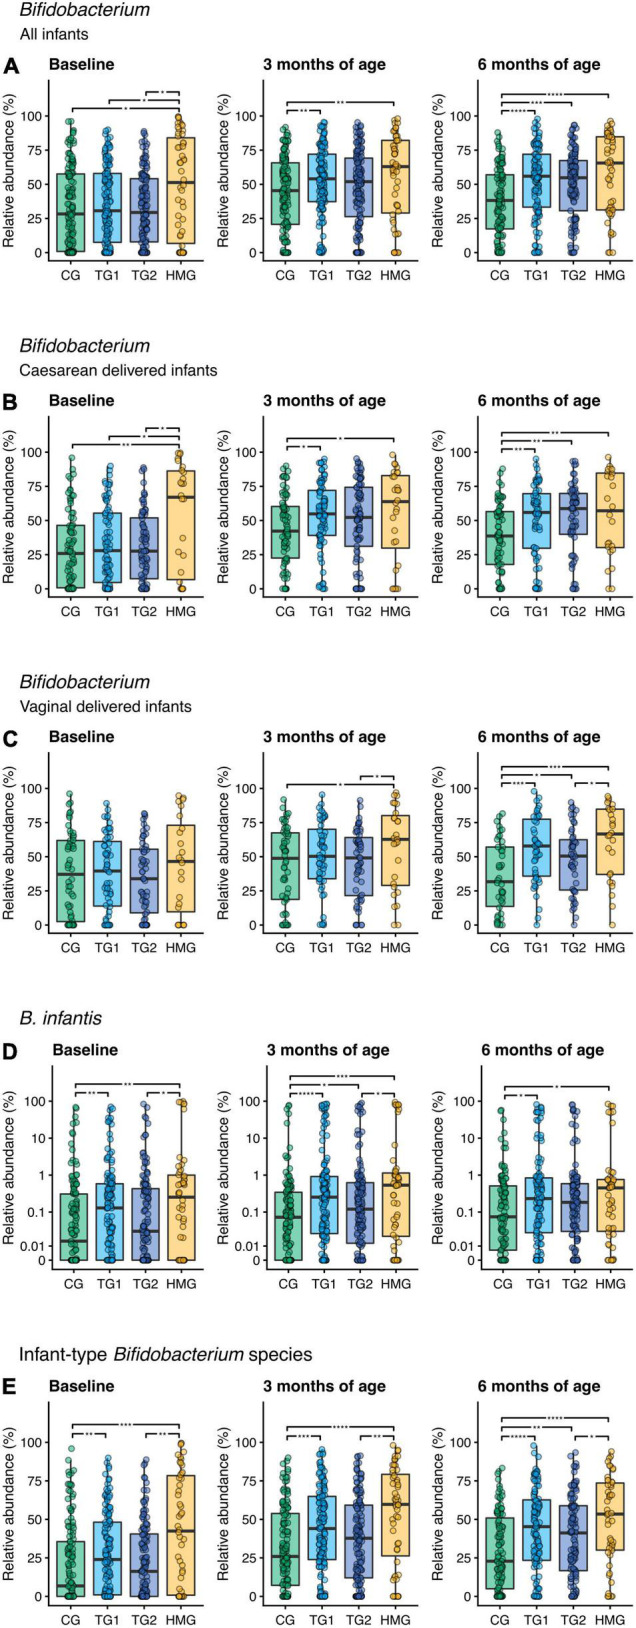
FIGURE 4.

Relative abundance of (A) Bifidobacterium including all infants, (B) Bifidobacterium in cesarean-delivered infants, (C) Bifidobacterium in vaginally delivered infants, (D) Bifidobacterium longum subsp. infantis (B. infantis), and (E) infant-type Bifidobacterium species in the four feeding groups at each timepoint (baseline left, 3 months of age center, 6 months of age right). Infant-type Bifidobacterium species is defined as the summarized relative abundance of B. longum subsp. infantis, B. longum subsp. longum, B. bifidum, and B. breve (36). Box plots show the median and 25th and 75th percentiles with Tukey whiskers. Relative abundance of B. infantis is plotted on a pseudo-logarithmic scale to display values spanning several orders of magnitude, as well as zeros. Within each timepoint, all feeding groups were compared pairwise (Dunn’s test), and significant differences are highlighted with significance bars. *P < 0.05, **P < 0.01, ***P < 0.001, ****P < 0.0001. At baseline/3/6 month of age, CG, n = 135/135/111; TG1, n = 140/138/113; TG2, n = 136/140/117; HMG, n = 50/55/50 for all infants (A,D,E), CG, n = 79/77/69; TG1, n = 81/82/66; TG2, n = 80/85/66; HMG, n = 26/28/24 for cesarean-delivered infants (B), CG, n = 56/58/42; TG1, n = 59/56/47; TG2, n = 56/55/51; HMG, n = 24/27/26 for vaginally delivered infants (C). CG, control group; TG1, test group 1 (1.5 g HMOs/L); TG2, test group 2 (1.5 g HMOs/L); HMG, human milk-fed group; HMOs, human milk oligosaccharides.
