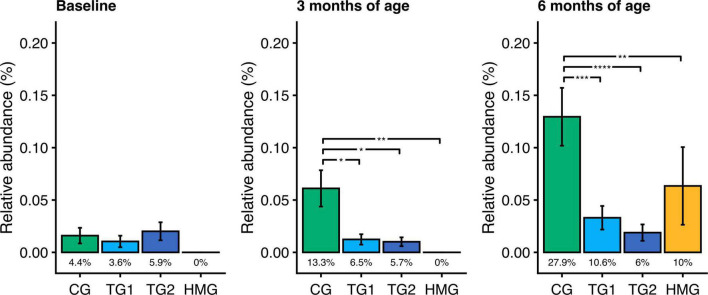
FIGURE 5.
Relative abundance of toxigenic Clostridioides difficile in the four feeding groups at each timepoint (baseline left, 3 months of age center, 6 months of age right). Bars show the mean relative abundance with error bars indicating the standard error. Prevalence for each group (percentage of infants with detectable levels of toxigenic C. difficile) is displayed below the bar. Within each timepoint, the relative abundance of C. difficile in all feeding groups were compared pairwise (Dunn’s test), and significant differences are highlighted with significance bars. *P < 0.05, **P < 0.01, ***P < 0.001, ****P < 0.0001. At baseline/3/6 months of age, CG, n = 135/135/111; TG1, n = 140/138/113; TG2, n = 136/140/117; HMG, n = 50/55/50. CG, control group; TG1, test group 1 (1.5 g HMOs/L); TG2, test group 2 (1.5 g HMOs/L); HMG, human milk-fed group; HMOs, human milk oligosaccharides.

